Figures & data
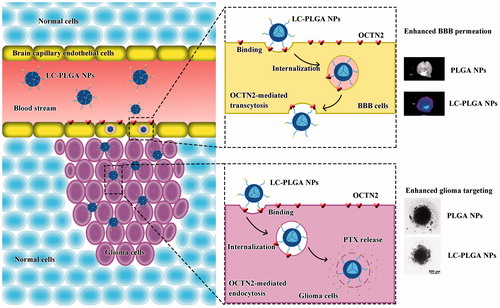
Scheme 1. Graphic illustration of the composition of l-Carnitine-conjugated nanoparticles with varied lengths of PEG spacers, and OCTN2-mediated BBB transcytosis and glioma targeting.
Figure 1. (A) Particle size and size distribution of PLGA NPs and L-Carnitine-conjugated nanoparticles; TEM image of LC-0-PLGA NPs (B), LC-500-PLGA NPs (C), LC-1000-PLGA NPs (D), and LC-2000-PLGA NPs (E); (F) In vitro release profiles of Taxol, paclitaxel-loaded PLG PLGA NPs, and l-Carnitine-conjugated nanoparticles; (G) Colloidal stability of paclitaxel-loaded PLGA NPs and LC-PLGA NPs in pH 7.4 PBS at 37 °C. Data are shown as mean ± SD, n = 3.
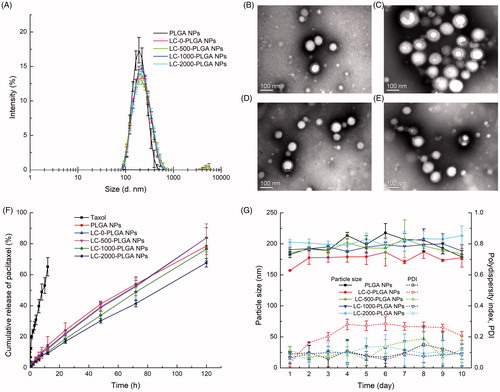
Table 1. Physicochemical characterization of LC-PLGA NPs.
Figure 2. Characterization of OCTN2 expression in brain capillary endothelial cells (hCEMC/D3) and glioblastoma multiforme cells (T98G). (A) RT-PCR; (B) Western blot; Immunofluorescence in hCMEC/D3 (C), and T98G (D) cells.
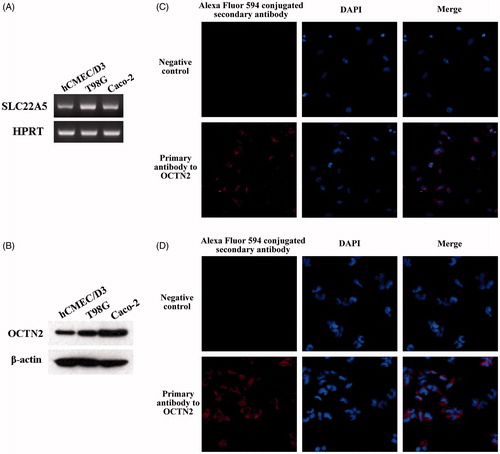
Figure 3. Characteristics of nanoparticles uptake in hCMEC/D3 cells. (A) Fluorescence images (20×) of hCMEC/D3 cells incubated with coumarin 6-loaded LC-PLGA NPs at 37 °C for 1 h. (B) Uptake assay for LC-PLGA NPs in NaCl buffer (control), NMDG chloride buffer (Na+-free), and NaCl buffer with 10 mM l-Carnitine. Data are shown as mean ± SD, n = 3. *p < .05, **p < .01 versus PLGA NPs group; α, p < .05, β, p < .01 versus control group. (C) Impact of inhibitors of various endocytosis pathways on the uptake of PLGA NPs and LC-1000-PLGA NPs in hCMEC/D3 cells. Data are shown as mean ± SD, n = 3. *p < .05, **p < .01 versus control group without inhibitor treatment.
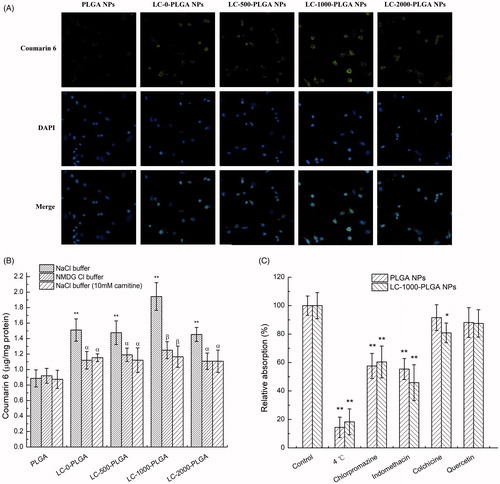
Figure 4. Characteristics of nanoparticles uptake in T98G cells. (A) Fluorescence images (20×) of T98G cells incubated with coumarin 6-loaded LC-PLGA NPs at 37 °C for 1 h. B, Uptake assay for LC-PLGA NPs in NaCl buffer (control), NMDG chloride buffer (Na+-free), and NaCl buffer with 10 mM l-Carnitine. Data are shown as mean ± SD, n = 3. *p < .05, **p < .01 versus PLGA NPs group; α, p < .05, β, p < .01 versus control group. (C) Impact of inhibitors of various endocytosis pathways on the uptake of PLGA NPs and LC-1000-PLGA NPs in T98G cells. Data are shown as mean ± SD, n = 3. *p < .05, **p < .01 versus control group without inhibitor treatment.
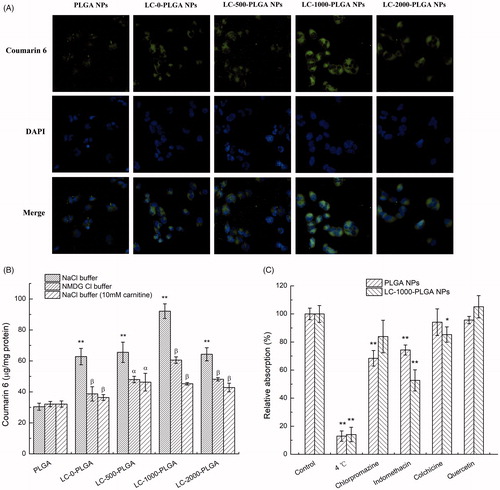
Figure 5. In vitro cytotoxicity of Taxol, paclitaxel-loaded PLGA NPs and LC-PLGA NPs in T98G cells. Data are shown as mean ± SD, n = 3. *p < .05, **p < .01 versus Taxol; α, p < .05, β, p < .01 versus PLGA NPs.
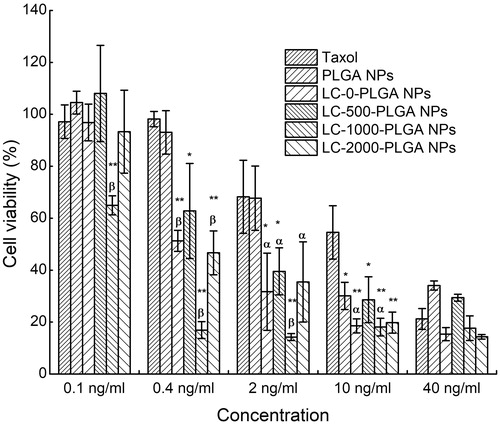
Figure 6. Brain distribution of paclitaxel after intravenous injection with Taxol, paclitaxel-loaded PLGA NPs and LC-PLGA NPs. Data are shown as mean ± SD, n = 3. *p < .05, **p < .01 versus Taxol; α, p < .05, β, p < .01 versus PLGA NPs.
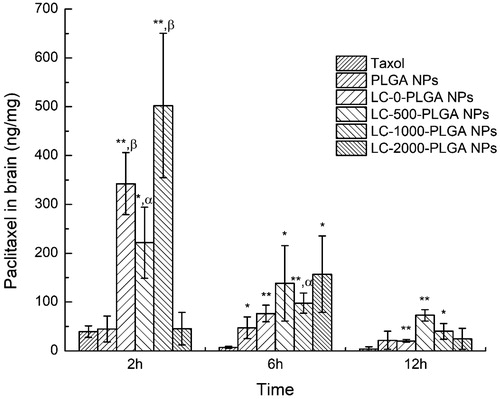
Figure 7. Biodistribution of DIR-loaded PLGA NPs, LC-0-PLGA NPs and LC-1000-PLGA NPs in mice. The organs from top to bottom: brain, heart, liver, spleen, lung, and kidney.
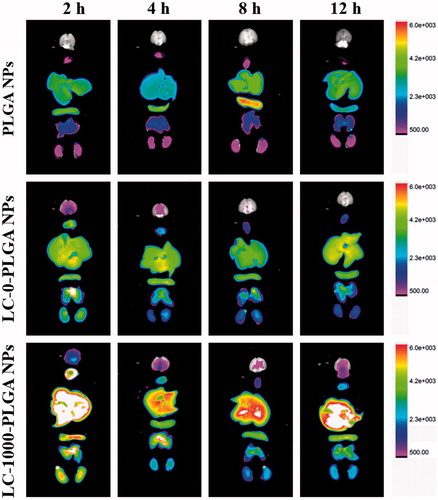
Figure 8. Response of T98G Spheroids to treatment with Taxol, paclitaxel-loaded PLGA NPs, LC-0-PLGA NPs and LC-1000-PLGA NPs. (A) The morphology change of T98G spheroids in a duration of 10 day-treatment with 10 μg/mL of Taxol, paclitaxel-loaded PLGA NPs and LC-PLGA NPs; (B) Compared to control group, the size change of T98G spheroids with treatment of 1 and 10 μg/mL of Taxol, paclitaxel-loaded PLGA NPs and LC-PLGA NPs. Data are shown as mean ± SD, n = 3.
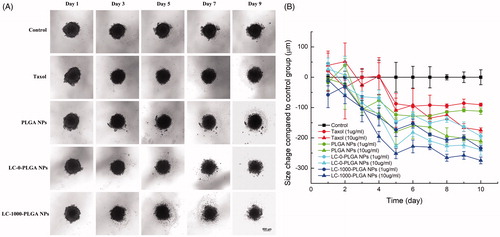
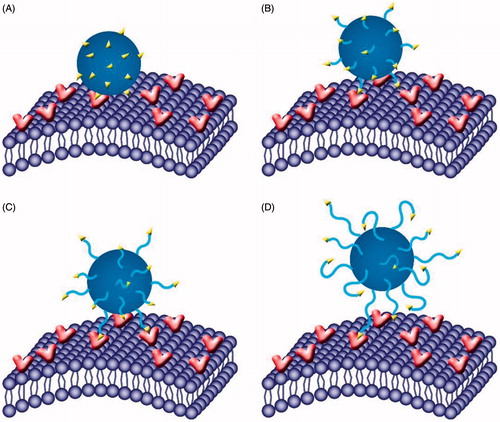
Figure 9. Role of PEG spacer in the targeting process. With molecular weight increasing from 0 (A) to 1000 (C), the PEG spacer could increase the flexibility and mobility, indicating a better targeting and binding efficiency for l-Carnitine to OCTN2; however, when increased further to 2000 (D), the PEG spacer was too long and small molecule l-Carnitine might be embedded into the PEG, hindering the binding efficiency of l-Carnitine to OCTN2.