Figures & data
Figure 1. (a) Schematic synthesis route of mPEG-PCL copolymer, (b) 1H-NMR spectrum of mPEG-PCL copolymer, and (c) GPC curve of copolymer P5.
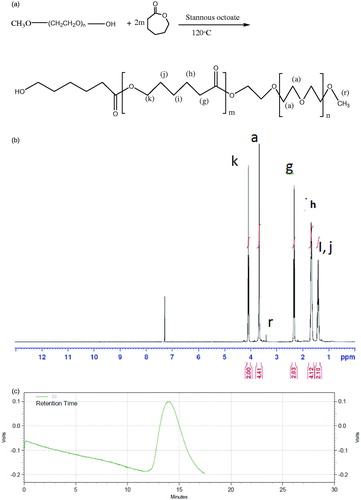
Table 1. Molecular characterics of the synthesized copolymers.
Figure 2. AFM image of gliclazide loaded spherical core shell micelles.
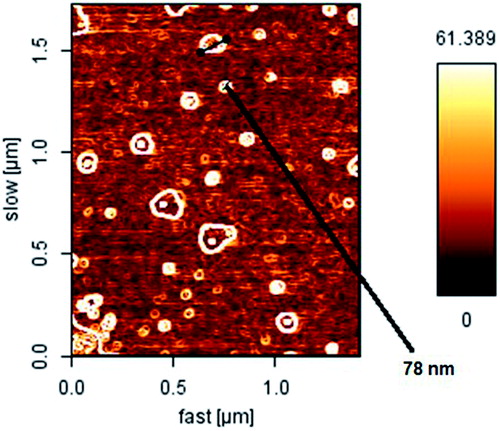
Figure 3. Particle size distribution and zeta potential of gliclazide/mPEG-PCL and mPEG-PCL micelles. (a) particle size distribution and (b) zeta potential of gliclazide/mPEG-PCL micelles.
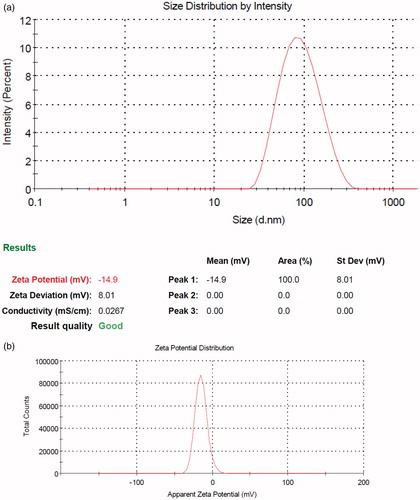
Figure 4. (a) Excitation spectra of pyrene in water for mPEG-PCL copolymer at various concentrationsand, (b) Intensity ratio I392/I373 of pyrene excitation spectra versus log C for mPEG-PCL copolymer.
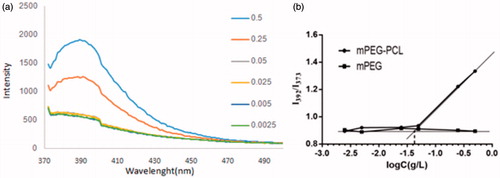
Figure 5. Stability micelles.
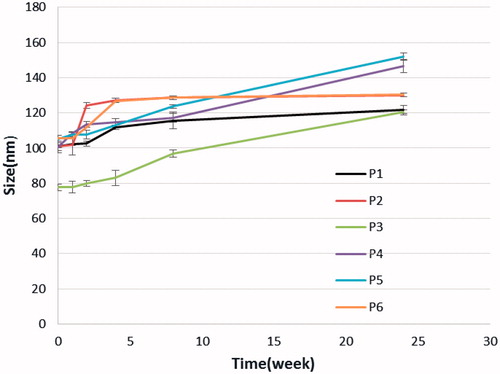
Table 2. Characterisistic of micelles from the synthesized copolymers.
Table 3. Properties of gliclazide-loaded mPEG-PCL micelles.
Figure 6. FT-IR spectra of (a) gliclazide, (b) gliclazide/mPEG-PCL micelles, and (c) mPEG-PCL.
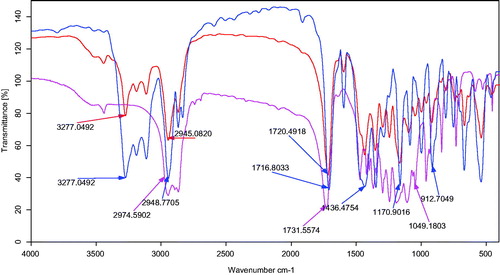
Figure 7. Differential scanning calorimetry (DSC) spectra of (a) gliclazide/mPEG-PCL micelles (b) gliclazide and (c) mPEG-PCL.
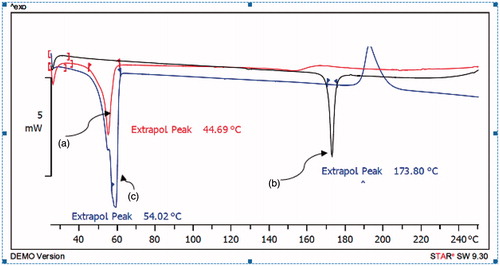
Figure 8. The release profiles of gliclazide from gliclazide/mPEG-PCL micelles in different release medias.
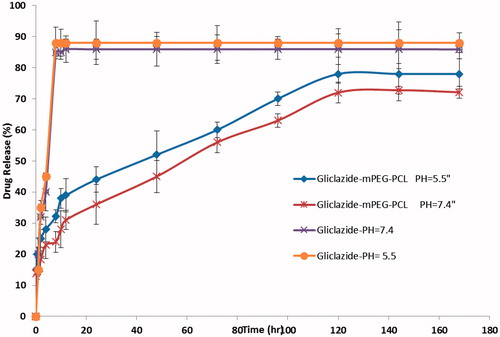
Figure 9. Solubility of gliclazide.
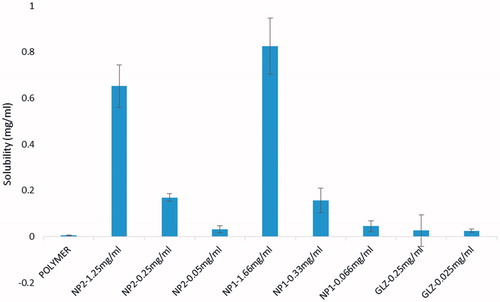
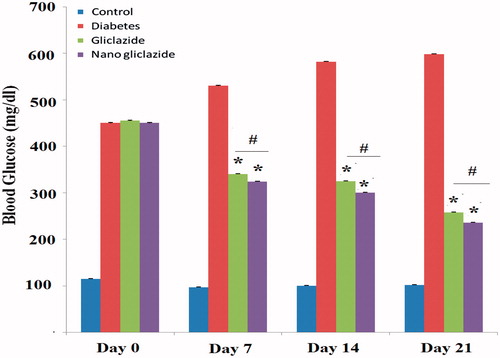
Figure 10. Effect of gliclazide and gliclazide/mPEG-PCL micelles on fasting blood sugar. All the values are expressed in mean ± SE (n = 6); *p < .05 compared to diabetic rat group; #p < .05 compared to gliclazide rat group.