Figures & data
Figure 1. (a) Schematic representation of reduction of metal ions by fungal secretary proteins (b) Nanoparticles formation on the basis of colour change due to surface plasmon resonance (c) UV–visible spectrophotometry of AgNPs and (d) Transmission electron microscopic analysis of AgNPs.
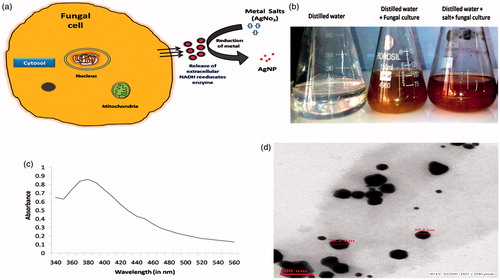
Figure 2. Comparative analysis of (a) antibacterial activity and (b) antifungal activity of AgNP for different pathogenic bacteria and fungi. Results are presented in relative units compared with controls (Ab) which is not shown in the graph. Different signs (* and **) letters indicate significant differences (p < .05).
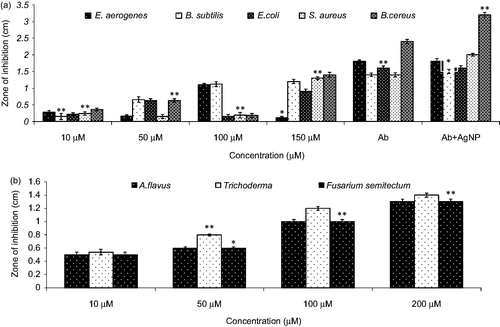
Figure 3. Dose-dependent effect of AgNPs over cell viability using MTT assays on J774 and THP1α cells. Results are presented in relative units compared with controls. Different signs (* and **) letters indicate significant differences (p < .05).
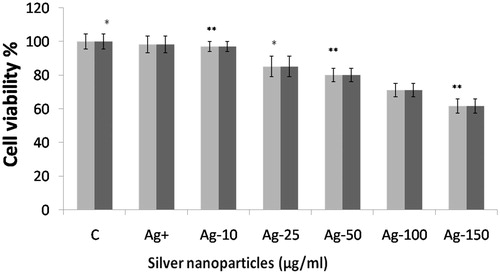
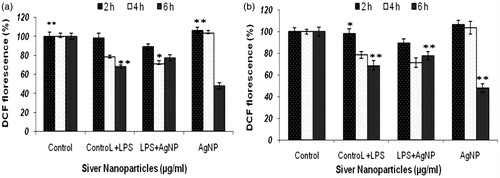
Figure 4. ROS estimation in (a) J774 cell lines and (b) THP1α cell lines after incubation with AgNPs at various time points (2, 4 and 6 h). Results are presented in relative units compared with controls. Different signs (* and **) letters indicate significant differences (p < .05).