Figures & data
Figure 1. Map of T-DNA regions of binary vectors used in this study. (A) pPZP-RCS2-nptII, (B) pPZP-RCS2-nptII/LoSilA1, (C) pPZP-RCS2-nptII/LoSilA1-EGFP, (D) pPZP-RCS2-nptII/EGFP. OCS-P and OCS-T – octopine synthase promoter and terminator sequences; 35 S-P and 35 S-T – cauliflower mosaic virus 35 S promoter and terminator sequences; NPT II – the neomycin phosphotransferase gene; LoSilA1 – the silicatein A1 gene from the Latrunculia oparinae; EGFP – the enhanced green fluorescent protein gene.
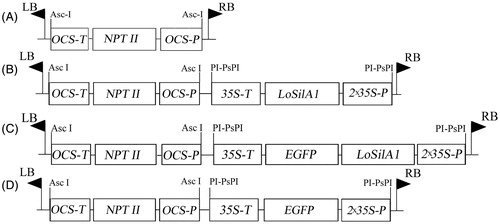
Figure 2. Electrophoretic separation of the PCR products. Nc, negative controls; Pc, positive controls; Nt-c and Nt-p, non-transformed callus and plant lines; Nt-cV and Nt-pV, callus and plant lines transformed with empty vector; Nt-cS and Nt-pS, callus and plant lines transformed with LoSilA1 gene; Nt-cSG and Nt-pSG, callus and plant lines transformed with LoSilA1 gene fused to a N-terminus of EGFP gene; Nt-cG and Nt-pG, callus and plant lines transformed with the EGFP gene.
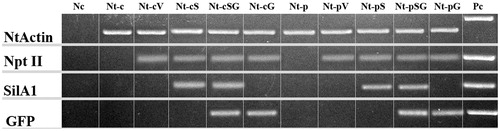
Figure 3. Live imaging of subcellular distribution of LoSilA1 in transgenic N. tabacum callus cultures (A) and plants (B). Phenotypes of the LoSilA1-EGFP transgenic callus and plant (A1 and B1, respectively). Confocal images of tobacco cells that express empty vector (A2 and B2, respectively) either EGFP alone (A3 and B3) or LoSilA1-EGFP fusion (A4 and B4) proteins. Images were generated using the fluorescent channel only.
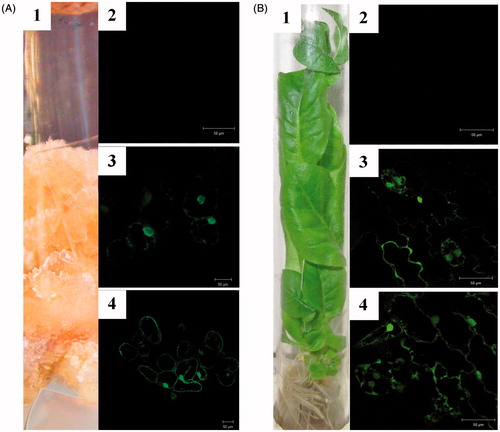
Figure 4. Representative images of silver nanoparticle dispersions synthesized with Nt-cV and Nt-cS callus extracts after a 24 h reaction time. Control flasks contained silver nitrate solution without adding callus extract.
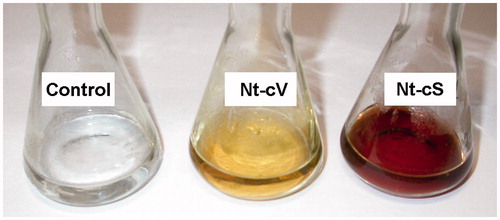
Figure 5. Representative images of silver nanoparticle dispersions synthesized with Nt-pV and Nt-pS plant extracts after a 24 h reaction time. Control flasks contained silver nitrate solution without adding callus extract.
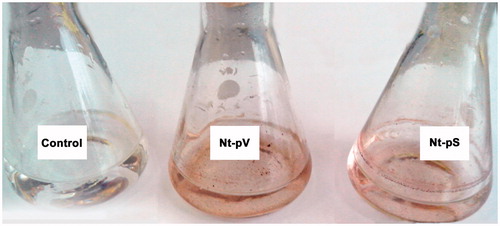
Figure 6. UV–Visible spectra of silver nanoparticles prepared using extracts from callus and plant lines of N. tabacum. Nt-cV and Nt-pV – callus and plant transformed with empty vector; Nt-cS and Nt-pS – callus and plant transformed with the LoSilA1 gene. Control flasks contained silver nitrate solution without adding callus extract.
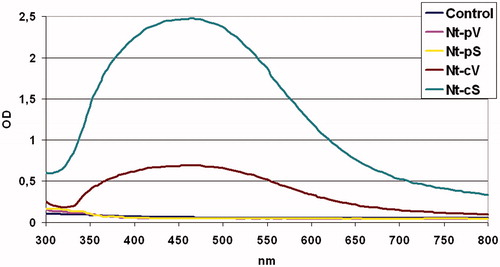
Figure 7. FTIR spectra of silver nanoparticles synthesized using Nt-cV (A) and Nt-cS (B) callus extracts.
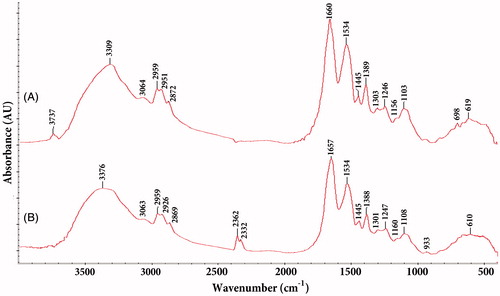
Figure 8. XRD spectra of AgNPs synthesized using Nt-cV (A) and Nt-cS (B) callus extracts.
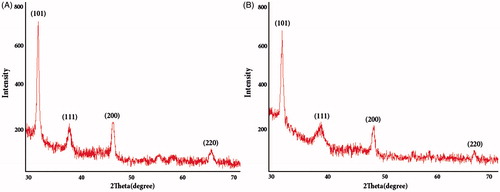
Figure 9. SEM images and EDS spectra of AgNPs synthesized using Nt-cV (A) and Nt-cS (B) callus extracts. Scale bar 200 nm.
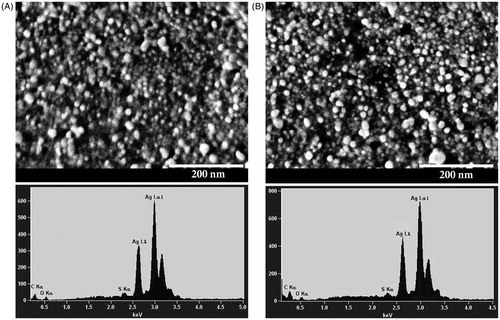
Figure 10. AFM topographic and phase images of AgNPs synthesized using Nt-cV (A) and Nt-cS (B) callus extracts. Scale bar 100 and 200 nm, respectively.
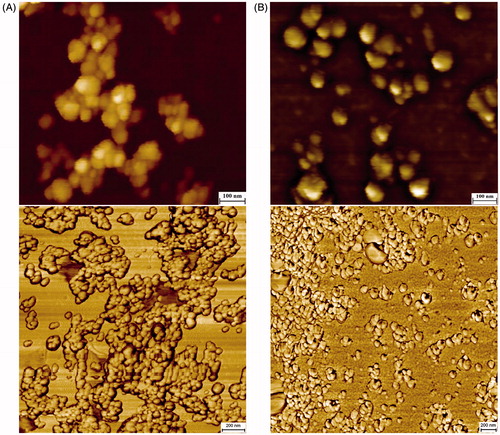
Figure 11. Size distribution of AgNPs synthesized using Nt-cV (A) and Nt-cS (B) callus extracts.
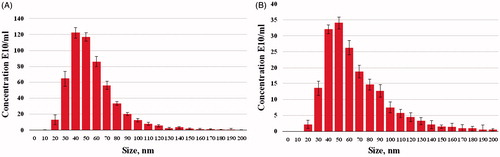
Table 1. Average zone of inhibition (mm) of AgNPs against E. coli and A. tumefaciens.
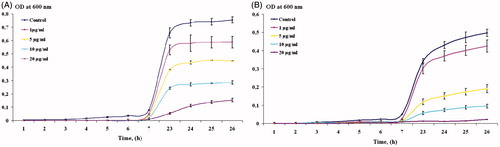
Figure 12. Determination of growth kinetics of E. coli and A. tumefaciens in presence of AgNPs. Data are shown as mean ± SE from three biological replicates.