Figures & data
Figure 1. Expression of specific genes in PSCs in vitro and in vivo. (A) Detection of PSC markers by IF staining. Nestin staining was located in the cytoplasm, while Pdx1 staining was located in the nucleus. The nestin, Pdx1 and DAPI signals appear as garland-like structures in merged images. Pdx1, a transcription factor, is recognized as a marker of PSCs in pancreas development (bar = 50 μm). (B) Detection of melatonin receptors by IF staining in PSCs in vitro. Melatonin receptors include MT1 and MT2, which were co-expressed in PSCs (bar = 200 μm). (C) IF analysis of sections in differentiated beta cell clusters stained for proinsulin and MT2 (bar = 50 μm). (D) Purification of PSCs by FCM using nestin antibody. (E) RT-PCR analysis of sections from differentiated beta cells and PSCs tested for MT1 and MT2. (F) Co-expression of nestin, MT1 and MT2 in pancreatic tissue using IHC. The results demonstrated that these genes were co-expressed in pancreatic islet structures (bar = 50 μm).
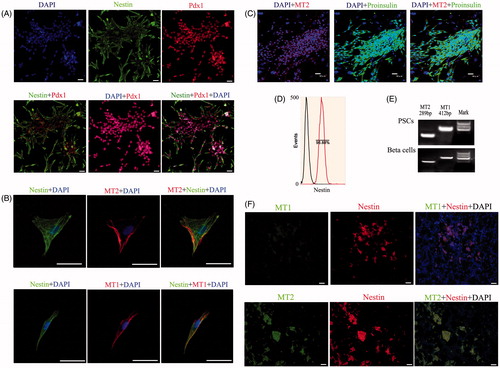
Figure 2. Melatonin increases nestin expression and cell viability in PSCs. (A) Nestin expression was tested using Western blotting and RT-PCR after PSCs were exposed to various melatonin concentrations. Results demonstrated that nestin levels increased in a concentration-dependent manner and that PSCs incubated with 10 μM melatonin had significantly increased expression levels compared with other groups. (B) The role of melatonin receptors in nestin expression. Melatonin receptors, including MT1 and MT2, belong to the family of G-protein–coupled receptors. For scanning biological functions of MT1 and MT2, siRNAs were used to knock MT1 or MT2 down when PSCs were exposed to 10 μM melatonin, and protein levels were analyzed using Western blotting. Results indicated that MT2 is an important melatonin receptor for the induction of nestin expression in PSCs. Protein abundance was analyzed using Image J tools and normalized using endogenous control. (C) PSC proliferation was assessed using Ki67-marked methods after treatment with various melatonin concentrations for 72 h.
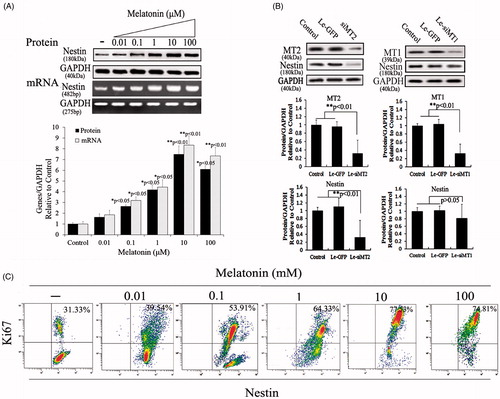
Figure 3. Role of melatonin receptors in melatonin-induced PSC proliferation. Melatonin promoted cell proliferation by activating the ERK pathway. To detect the roles of MT1, MT2 and ERK1/2 in melatonin-treated PSCs, we exposed siMT1, siMT2, siERK1, siERK2 and SCH772984 to melatonin-treated PSCs. (A) Western blotting revealed that melatonin activated the ERK pathway via MT2, and nestin expression levels were positively correlated with activation of the ERK pathway and decreased when siERK1, siERK2 or SCH772984 was exposed to melatonin-treated PSCs. C: control, without melatonin; M: 10 μM melatonin added to PSC culture; siMT1: siRNA of MT1; siMT2: siRNA of MT2; SCH: SCH772984, ERK pathway inhibitor; siE1: siRNA of ERK1; siE2: siRNA of ERK2. Protein abundance was analyzed using ImageJ tools and normalized using endogenous controls. (B) PSC proliferation was assessed using Ki67-marked methods after treatment with different factors for 72 h.
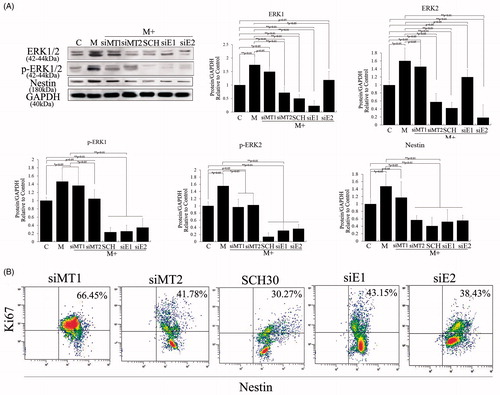
Figure 4. Role of TGF-β/SMAD pathway in melatonin-induced PSC proliferation. TGF-β1 pathway inhibitor (SB431542), siS2, siS3 and siS4 were used to test the functions of this pathway. (A) Western blotting revealed that melatonin promotes expression of Smad2, Smad3 and Smad4 and that nestin expression levels were positively correlated with expression of Smad2, Smad3 and Smad4. These levels were significantly decreased when siS2, siS3, siS4 or SB431542 was applied to melatonin-treated PSCs. (B) PSC proliferation was assessed using Ki67-marked methods after treatment with different factors for 72 h.
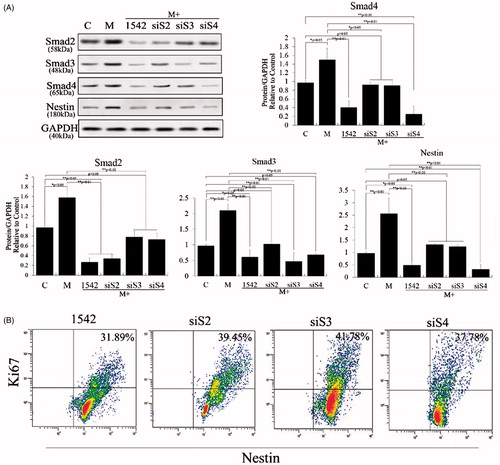
Figure 5. Crosstalk between ERK and TGF-β/SMADs pathways in melatonin-induced PSCs. ERK1, ERK2, Smad2, Smad3 and Smad4 were knocked down using RNAi to analyze their effects in PSCs after melatonin treatment. The results revealed that ERK1 knockdown significantly suppressed melatonin-induced ERK1/2 and Smad2/3 expression (p < .01), but ERK2 knockdown did not do so (p > .05). Smad2/3 knockdown also significantly suppressed melatonin-induced ERK1/2 and Smad2/3 expression (p < .01), but Smad4 knockdown did not (p > .05). These results suggest that Smad2/3 may be involved in melatonin-induced phosphorylation and expression of ERK1/2, which is positive feedback in the regulation of Smad2/3 and ERK1/2.
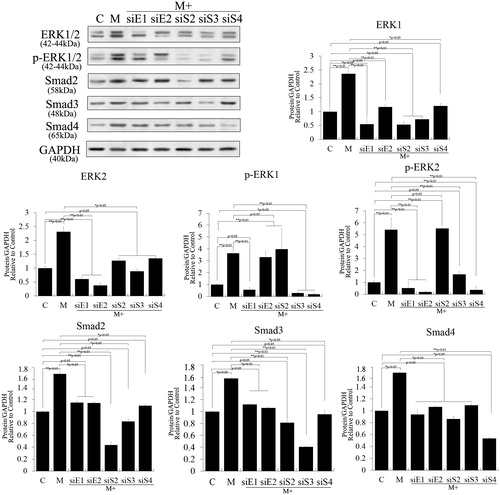
Figure 6. Crosstalk among nestin and the ERK and TGF-β/SMADs pathways in PSCs. Nestin was overexpressed in PSCs to test feedback of the TGF-β/SMADs pathway. Lentivirus expressing nestin significantly increased nestin expression compared with control cells in PSCs. However, nestin overexpression negligibly affected phosphorylation and expression of ERK1/2, Smad2 and Smad3 (p > .05). The expression level of Smad4 changed significantly (p < .05).
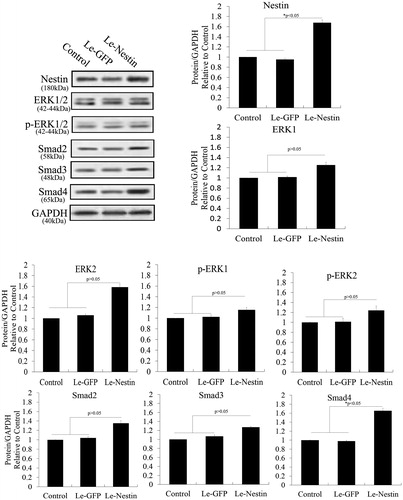
Figure 7. Knockdown of nestin to test feedback of the ERK and TGF-β/SMADs pathways in PSCs. Nestin was knocked down using RNAi. Western blotting revealed that lentivirus expressing siRNA of nestin (siNes) significantly decreased nestin expression in PSCs compared with controls (p < .05). However, nestin knockdown negligibly affected the phosphorylation and expression of ERK1/2, Smad2, Smad3 and Smad4 (p > .05).
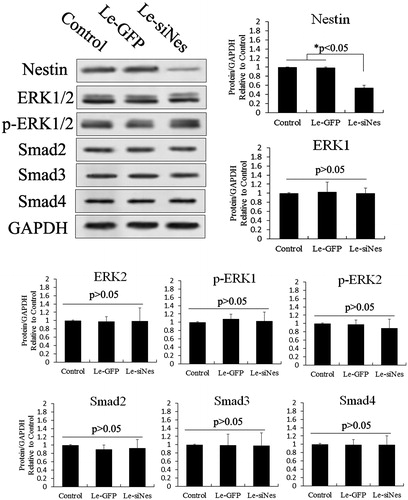
Figure 8. Proliferation assessed after treatment with different siRNAs in melatonin-treated PSCs. (A) Ki67-marked analysis of proliferation after overexpression of nestin in melatonin-treated PSCs, as well as Ki67-marked analysis of proliferation after RNAi-nestin treatment in melatonin-treated PSCs. (B) Statistical analysis of the proliferation effect of gene silencing combined with melatonin treatment in PSCs using Ki67-marked methods. These results showed that melatonin induced cell proliferation by activating the MT2/ERK/SMAD/nestin axis in PSCs. Ki67-positive stem cells were counted from 3 random culture dishes in each of 3 independent PSC samples.
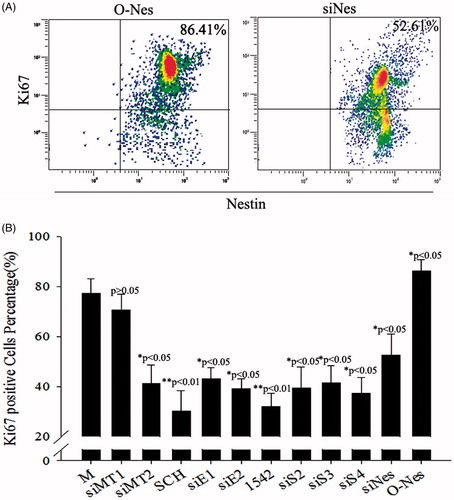
Figure 9. Insulin expression in beta cells derived with different combinations of inducers. Analyses of proinsulin expression using FCM. The percentage of cells expressing insulin was highest in G2. C: control; G1: group 1, PSCs; G2: group 2, PSCs induced with a cocktail of growth factors; G3: group 3, melatonin-treated PSCs induced with growth factors; G4: group 4, melatonin-treated PSCs overexpressing siMT1 and induced with growth factors; G5: group 5, melatonin-treated PSCs overexpressing siMT2 and induced with growth factors; G6: group 6, melatonin plus SCH772984-treated PSCs induced with growth factors; G7: group 7, melatonin plus SB431542-treated PSCs induced with growth factors.
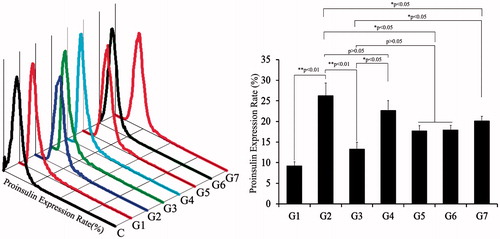
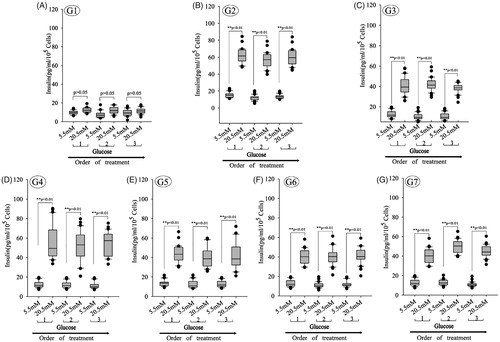
Figure 10. Glucose-induced insulin secretion in beta cells derived with different combinations of inducers. (A–G) Glucose-induced insulin secretion in beta cells derived with different combinations of inducers. The box plots show that insulin secretion increased when the glucose concentration increased in all groups except group 1 (n = 30; paired 2-tailed t test). G1: group 1, PSCs; G2: group 2, PSCs induced with a cocktail of growth factors; G3: group 3, melatonin-treated PSCs induced with growth factors; G4: group 4, melatonin-treated PSCs overexpressing siMT1 and induced with growth factors; G5: group 5, melatonin-treated PSCs overexpressing siMT2 and induced with growth factors; G6: group 6, melatonin plus SCH772984-treated PSCs induced with growth factors; G7: group 7, melatonin plus SB431542-treated PSCs induced with growth factors.