
Figures & data
Figure 1. Schematic diagram of IgG and IgY.
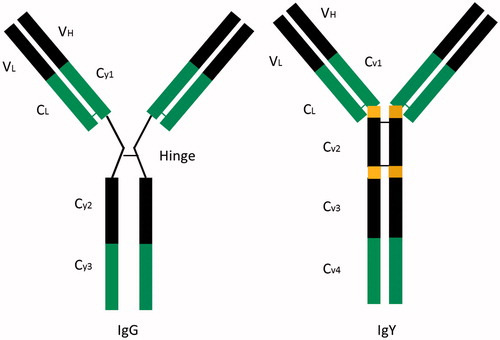
Figure 2. (A) Schematic diagram of the QD-based immunochromatographic assay for RHE. For each test, 20 μL sample solution was dripped onto the sample hold, the QDs-IgY conjugate solubilized by the sample solution reacted with RHE. The QDs were capable of emitting strong fluorescence in the inspect window under 365 nm. (B) The assembly of QD-based dipstick and plastic housing under ultraviolet light.
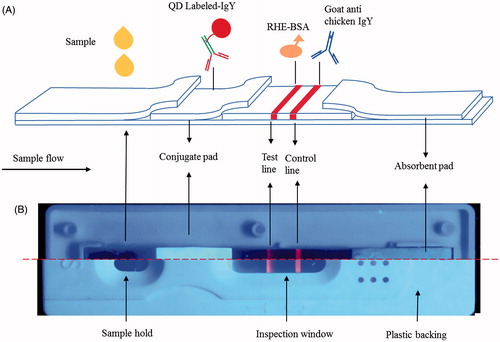
Figure 3. (A) The process of IgY purification from egg yolk. (B) Standard curve of RHE determination using icELISA. The regression equation was y = −0.094ln(x) + 1.0224, with R2 = 0.9944.
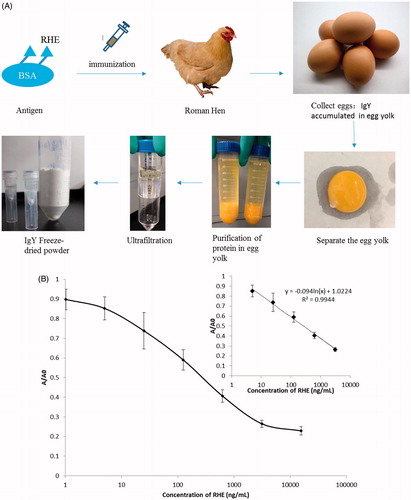
Figure 4. (A) Qualitative results obtained using the LCS test for RHE showing negative (A1) and positive samples (A2) under ultraviolet light. Fluorescence appearing at both the test and control lines indicated that the sample was free of RHE. Fluorescence appearing only at the control line indicated that the sample was positive for RHE. (B) Photograph of the matched-scanning luminoscope. (C) The fluorescence-intensity pattern scanned by the luminoscope. (D) Standard curve for RHE determination using icELISA. The regression equation was y = −0.128ln(x) + 1.7627, with R2 = 0.9792.
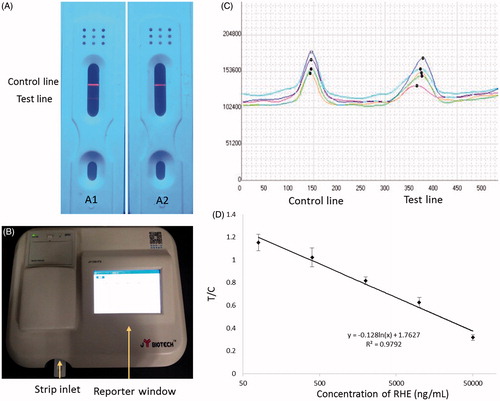
Table 1. Cross-reactivity of compounds measured by LCS and icELISA.
Table 2. Comparative analysis of LCS and HPLC.
Table 3. Recovery of RHE in rat serum determined by ELISA in spiked samples.
Table 4. Variations in LCS for RHE analysis.