Figures & data
Figure 1. MiR-9 is down-regulated in OSCCs. Expression level of miR-9 in each individual case of OSCCs, adjacent normal tissues and normal mucosa tissues was evaluated using RT-qPCR. Small nuclear RNA (snRNA) U6 was used as an internal control. Data are presented as mean ± SD (insert). Details are described in the Materials and methods. T: OSCC tissues; AN: adjacent normal tissues; N: normal mucosa tissues; **p < .01.
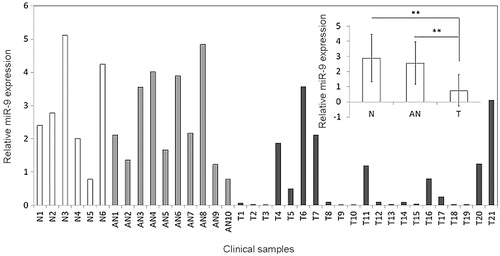
Figure 2. MiR-9 inhibits OSCC cell growth. (A) Restoration of MiR-9 expression in Tca8113 cells was evidenced by RT-qPCR. SnRNA U6 was used as a normalized control. ***p < .001. (B) MiR-9 significantly inhibited cell proliferation in Tca8113 cells. *p < .05; **p < .01. The effect of miR-9 on cell growth was further confirmed by colony formation (C) and anchorage independent growth assays (D). Left panel showed the representative image of colony formation in Tca8113 cells transfected with miR-9 mimics and miRNA control. Quantitative analysis of colony numbers is shown in the right panel. Details are described in the “Materials and methods”. Data are presented as mean ± SD of values from three different assays. *p < .05; **p < .01.
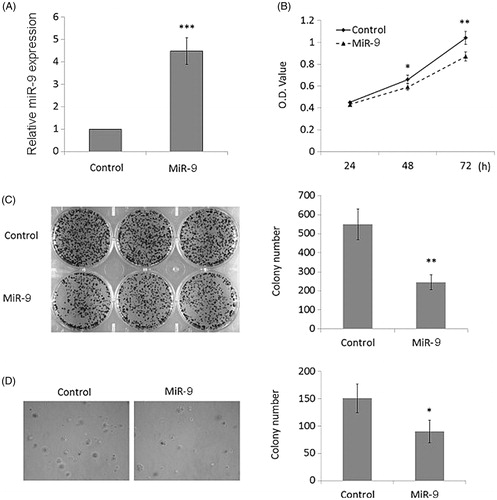
Figure 3. MiR-9 induces OSCC cell cycle arrest. Tca8113 cells were transiently transfected with miR-9 mimics and miRNA control. After 72 h post-transfection, DNA content was measured by flow cytometry to determine cell cycle fractions. Representative flow cytometric histograms of cells transfected with miR-9 mimics and miRNA control from three independent experiments are shown in panel A. The fraction of cells in each cell cycle phase is indicated in panel B. PI: propidium iodide; *p < .05.
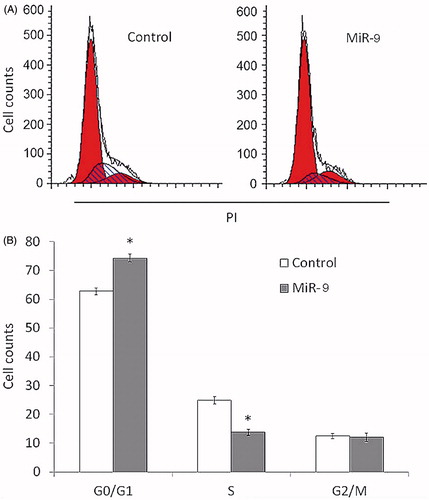
Figure 4. MiR-9 induces OSCC cell apoptosis. Cell apoptosis is measured by flow cytometry analysis of Annexin V-FITC double-labelled Tca8113 cells transfected with miR-9 mimics and miRNA control. (A) Flow cytometry profile represents Annexin V-FITC staining in x axis and propidium iodide (PI) in y axis. Dual staining of cells with Annexin V-FITC and PI enabled categorization of cells into four regions. Region Q1 shows the necrotic cells, Q2 shows the late apoptotic cells, Q3 shows the live cells, and Q4 shows the early apoptotic cells. (B) The experiment was repeated three times and data represent the average of the early apoptotic and late apoptotic cells. *p < .05.
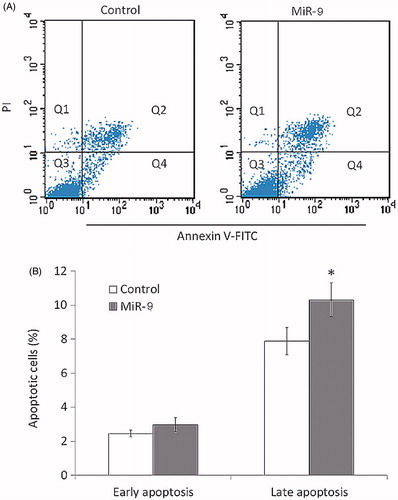
Figure 5. MiR-9 inhibits OSCC cell invasion. Cells transfected with miR-9 mimics and miRNA control were starved overnight and then seeded in the Transwell chambers coated with Matrigel for invasion assay. Following a 24 h-culture, non-invading cells in the upper chamber were removed and invading cells were stained and calculated in four microscopic fields per sample. Details are described in the “Materials and methods”. Shown are representative images of invading cells (A). The bar graphs (B), corresponding to upper panels, show mean ± SD of the numbers of invading cells from three independent experiments. **p < .01.
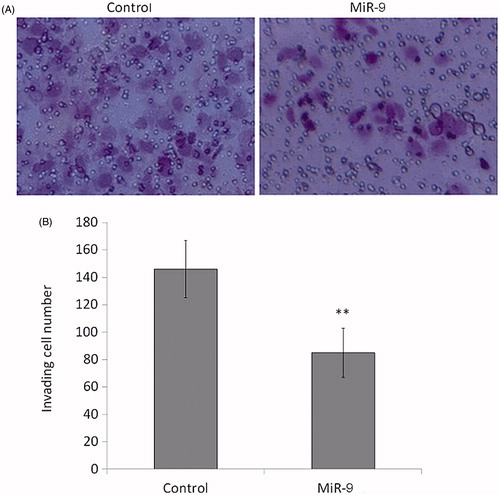
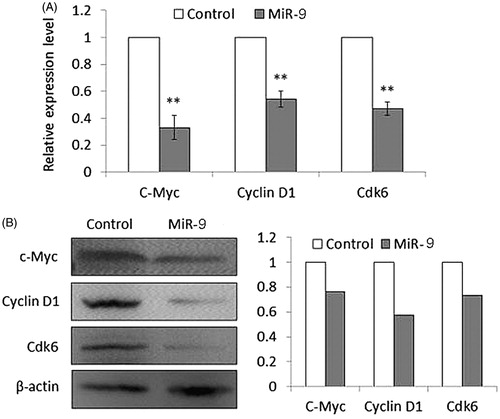
Figure 6. MiR-9 inhibits the expression of c-Myc, Cyclin D1, and Cdk6 in Tca8113 cells. Cells transfected with miR-9 mimics and miRNA control were starved overnight and harvested. (A) Total RNA was isolated and RT-qPCR was performed to evaluate the expression of c-Myc, Cyclin D1, and Cdk6. Details are described in the “Materials and methods”. **p < .01. (B) Cell lysates were collected and subjected to Western blotting assays. The biological functions of miR-9 in Tca8113 cells were determined by blotting c-Myc and its downstream target, cyclin D1, as well as Cdk6. β-actin was used for loading control of Western blotting. Shown in the right portion of the panel is a quantitative illustration of expression of the indicated proteins using densitometry to measure the density of the corresponding bands on Western blot shown in the left portion of the panel.