
Figures & data
Figure 1. Pictorial representation of synthetic scheme of C60-OH-APA-DTX conjugate.
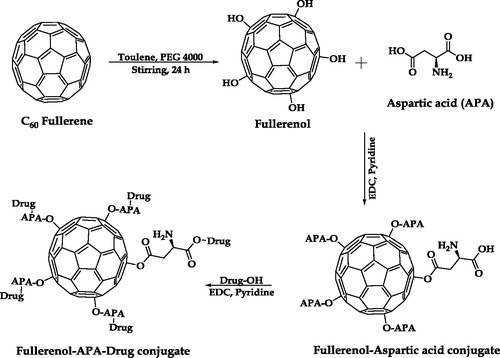
Figure 2. FT-IR spectrum of: (A) Fullerenols; (B) C60-OH-APA and (C) C60-OH-APA-DTX conjugate.
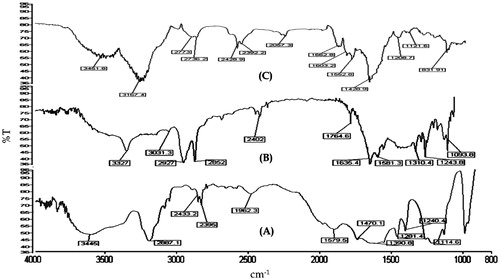
Figure 3. 1H NMR spectrum of: (A) Fullerenol with deuterium exchange and (B) C60-OH-APA-DTX conjugate.
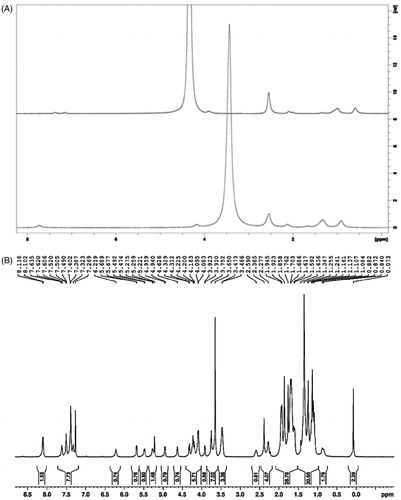
Figure 4. X-ray diffraction patterns of: (A) Naïve fullerenes; (B) Fullerenols; (C) Pure DTX and (D) C60-OH-APA-DTX conjugate.
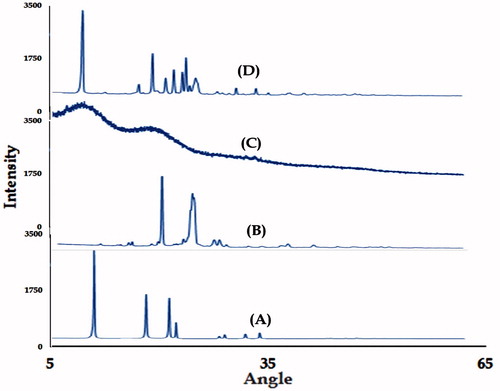
Figure 5. FE-SEM images at X for: (A) naïve fullerenes and (B) C60-OH-APA-DTX conjugate.
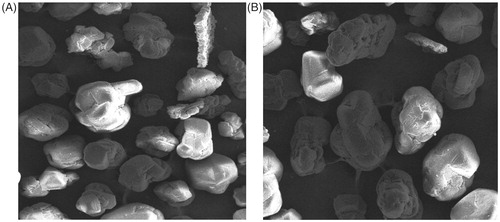
Table 1. Results of particle size, poly dispersity index (PDI) and zeta potential studies.
Figure 6. Graphs showing % drug release of pure DTX and C60-OH-APA-DTX conjugate at pH 5.6 and 7.4 respectively at t = 24 h.
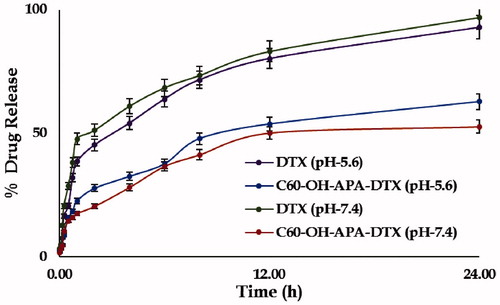
Figure 7. Bar graph showing % cell viability of pure DTX and C60-OH-APA-DTX conjugate at various concentrations.
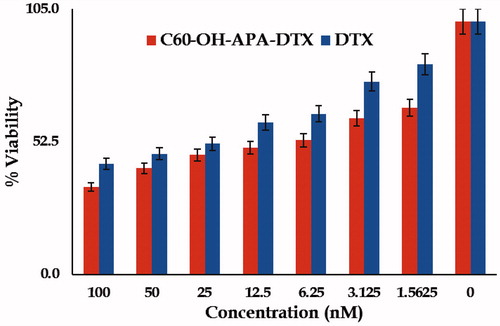
Figure 8. Confocal laser scanning microphotographs of (A) Control and (B) C60-OH-APA-DTX treated group.
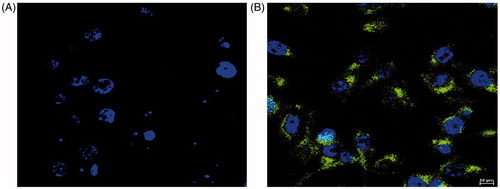
Table 2. Various pharmacokinetic parameters obtained from in-vivo pharmacokinetic studies.