Figures & data
Figure 1. (a) Schematic representation of the recombinant protein (NMM). Motifs in the protein have been demonstrated in single alphabet code: NLS: GPKKKRKVED and Mu: MRRAHHRRRRASHRRMRGG. (b) The NMM encoding gene was sub-cloned into the PET28a plasmid and verified by sequencing.
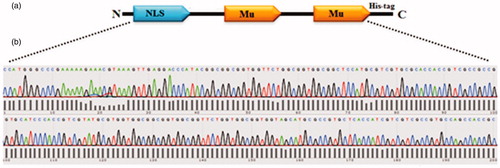
Figure 2. SDS-PAGE analysis of NMM expression in E. coli DE3 strain. (a) Soluble and insoluble fractions on 15% SDS-PAGE gel after IPTG induction. (b) The eluted fractions from the Ni-NTA-sepharose column was analyzed with 15% SDS-PAGE. Lane 1: The eluted fraction belongs to total protein content after cell lysis. Lane 2: flow-though, lanes 3 and 4: first and last washing, lanes 5–8: eluted fractions and lane 9: desalted fraction, M is protein marker. (c) NMM fusion protein was analyzed by SDS-PAGE, transferred to 0.2 µm PVDF membrane and detected by polyclonal anti-his tag antibody. Lane 1: total protein after cell lysis, lane 2: flow through and lane 3–8: eluted fractions. Ins: insoluble fraction; Sol: soluble fraction; NMM: NLS-Mu-Mu.
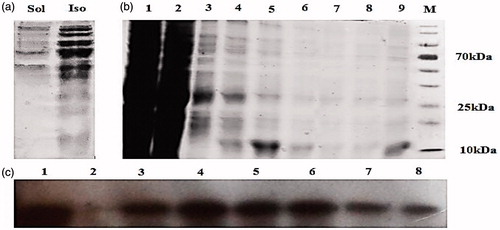
Table 1. Some properties of NLS-Mu-Mu and protamine used in this study.
Figure 3. (a) (a) EMSA assay for different NMM and protamine/pDNA ratios: lane 1: naked plasmid, lane 2–7: six N/P ratios (1, 3, 5, 7, 9, and 11). Each lane indicates a stepwise increase in the peptide or protein/pDNA. The pDNA is retained from N/P 7 onward completely in both protamine and NMM complexes. BSA was used as a negative control. (b) Integrity of pDNA released from the NMM and protamine complexes after incubating them with heparin. Lanes N: naked plasmid with heparin; lanes 1–9 and 1’–9′: NMM and Protamine at N/P 1–9, respectively. (c) The effect of DNase1 on the stability of condensed plasmid. Lanes N and N?: naked plasmid; lanes 1–9 and 1′–9′: NMM and Protamine at N/P 1–9, respectively. NMM: NLS-Mu-Mu; N/P ratio: nitogen to phosphate ratio.
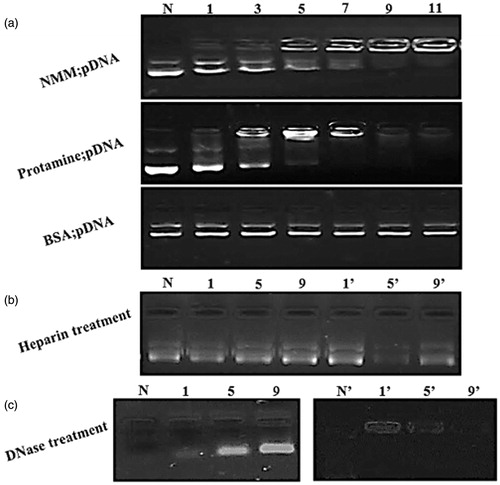
Figure 4. Ethidium bromide (EtBr) exclusion assay of NMM and protamine. Titration curves depicting the release of EtBr from pDNA upon binding NMM (solid squares) and protamine (solid triangles). The assay was conducted in PBS (10 mM, pH 7.4). Graphs represent gradual decreasing in % fluorescent intensity of EtBr due to EtBr exclusion across N/P charge ratios ranging 1 to 11. NMM: NLS-Mu-Mu; N/P ratio: nitrogen to phosphate ratio.
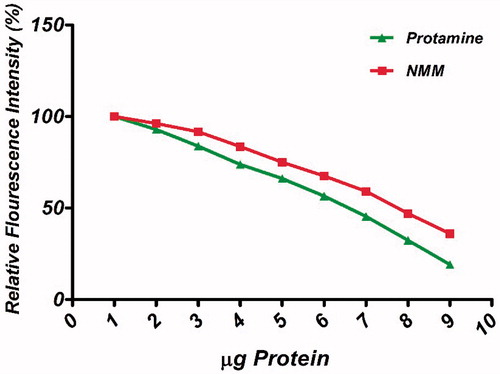
Figure 5. Visualization of NMM:pDNA and naked pDNA by AFM. (a) and (b) height image of naked pDNA and 3D rendering of AFM image, respectively; (c) and (d) height image of NMM/pDNA complexes formed at 9 N/P ratios and 3D rendering of AFM image, respectively. Each image represents a 2 × 2 mm scan. NMM: NLS-Mu-Mu; N/P ratio: nitrogen to phosphate ratio.
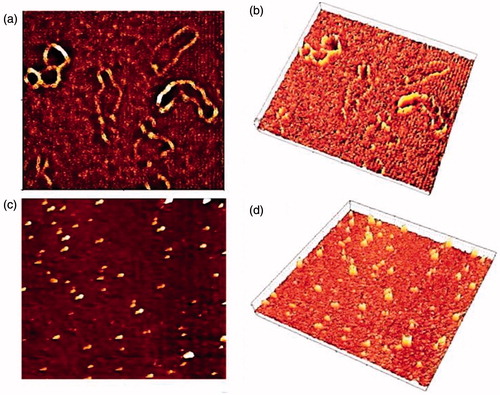
Figure 6. CD curves for NMM protein and NMM/pDNA complex at 9 N/P. Differences between the spectra probably are belong to the binding of NMM to pDNA. The results were analyzed by CDNN software which showed the fit mechanism for NMM/pDNA interaction that enhanced α-helices. NMM: NLS-Mu-Mu; N/P ratio: nitrogen to phosphate ratio.
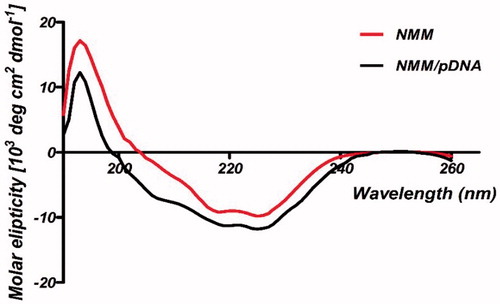
Figure 7. PicoGreen assay for the quantification of the DNA bound in NMM and protamine complexes at different molar ratios ranging from 1 to 9 N/P molar ratios. Results are represented as mean ± SD (n = 3). NMM: NLS-Mu-Mu; N/P ratio: nitrogen to phosphate ratio; Prot: protamine.
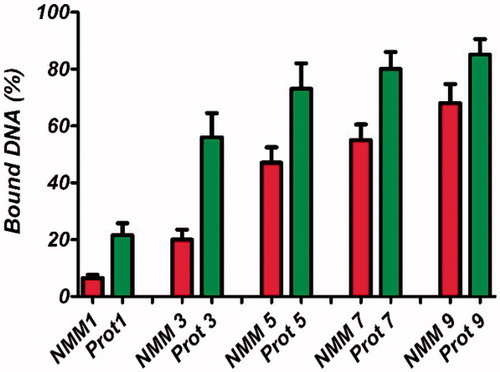
Figure 8. (a) Particle size and zeta potential of NMM binary complexes at N/P ratios ranging from 1 to 11. (b) Particle size and zeta potential of protamine binary complexes at N/P ratios ranging from 1 to 11. The results are presented as mean ± SD (n = 3). NMM: NLS-Mu-Mu; N/P ratio: nitrogen to phosphate ratio; Prot: protamine.
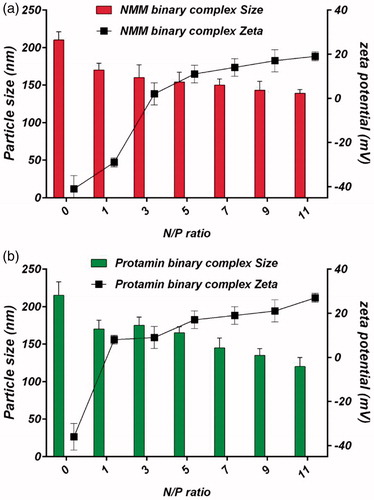
Figure 9. Hemolysis of binary and ternary complexes at different N/P molar ratios. Low levels of hemolysis are observed with the NMM/pDNA complexes. All results are expressed in relation to 100% hemolysis observed in the presence of Triton X-100. The results are presented as mean ± SD (n = 3). NMM: NLS-Mu-Mu; N/P ratio: nitrogen to phosphate ratio; Prot: protamine; TC: ternary complex with NMM.
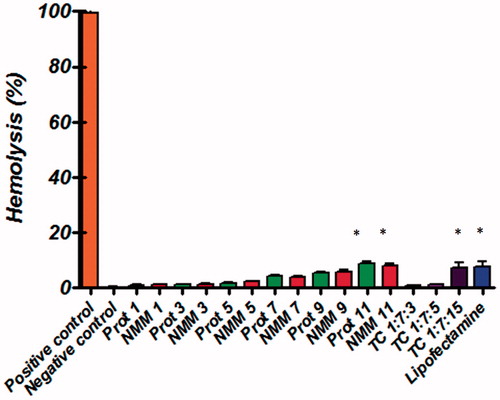
Figure 10. Comparison of the cell viability of NMM/DNA and Prot/DNA complexes at various N/P ratios. Each value represents the mean ± SD of three wells. *Difference values were statistically significant (p < .05). Each group was compared to control. NMM: NLS-Mu-Mu; N/P ratio: nitrogen to phosphate ratio; Prot: protamine; TC: ternary complex with NMM.
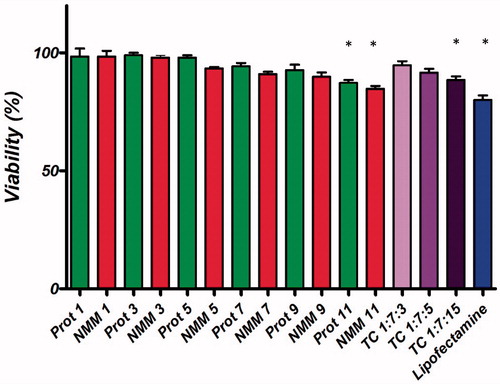
Figure 11. Representative fluorescent images of transfection efficiency in HEK293T cell line. Naked plasmid (a), DP transfection (b), DN transfection (c), DPN transfection (d) and DNN transfection (e) in HEK293T cells detected by red fluorescence protein (mCherry) using a fluorescence microscope at 48 h after transfection. Transfections were performed in 96-well plates using 1 µg of plasmid per well. DP: DNA/protamine; DN: DNA/NMM; DPN: DNA/protamine/noisome; DNN: DNA/NMM/niosome.
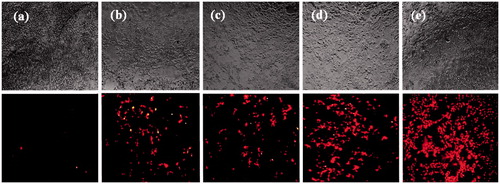
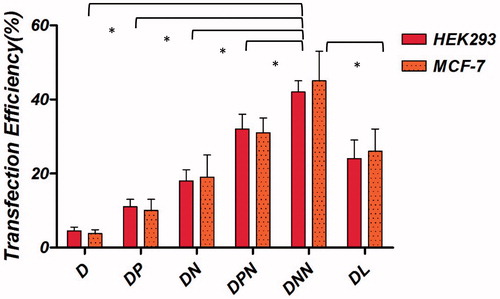
Figure 12. Transfection efficiency of m-Cherry gene with the binary and ternary complexes in different cell lines. The binary complexes were made and further encapsulated into cationic niosome vesicles. These particles were incubated with HEK293T and MCF-7 cells in serum free medium and gene expression was evaluated. Statistical analysis was performed with one-way analysis of variance (ANOVA) followed by Tukey's post-hoc test. #p < .05. D: DNA; DP: DNA/protamine, DN: DNA/NMM; DPN: DNA/protamine/noisome; DNN: DNA/NMM/niosome; DL: DNA/Lipofectamine™2000.