
Figures & data
Table 1. The primer sequences.
Figure 1. The Mcl-1 and Survivin proteins expression levels in treated human myelomonocytic leukaemia cells. (A) Representative western blot bands of β-actin, Mcl-1 and Survivin proteins from U937 cells transfected with siRNAs. (B) The density of each band was quantified by the Image J software (NIH, Bethesda, MD) and the expression of each Mcl-1 and Survivin normalized to the corresponding β-actin. Results are expressed in relation to the blank control. The data represent mean ± SD (n = 3); *p < .05 versus blank control.
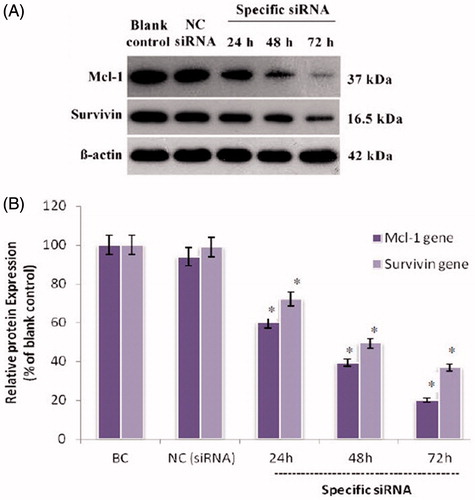
Figure 2. (A) Effect of siRNAs co-transfection on etoposide sensitivity of U-937 cells. Six hours after transfection of siRNAs or NC siRNA, cells were exposed to etoposide at indicated doses. After 18 h, cytotoxicity of treatments was determined by MTT assay as described above. The data represent mean ± SD (n = 4); *p < .05 versus etoposide or Mcl-1 siRNA alone; #p < .05 versus blank control. (B) Dose–response curves of treatments in MTT assay. A dose–response curve was created with the familiar symmetrical sigmoidal shape model which fit a dose–response curve to determine the IC50 of the etoposide. The data represent mean ± SD (n = 4).
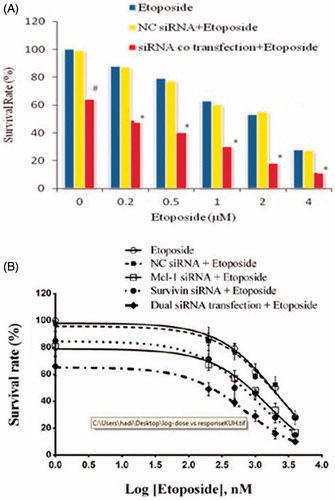
Figure 3. Effect of combination of Mcl-1 and Survivin suppression on etoposide-induced apoptosis. After 6 h of siRNAs co-transfection, the cells were exposed to etoposide (IC50) for 18 h. After 24 h of siRNA transfection, ELISA cell death assay was used to measure apoptosis induction. The results are expressed as mean ± SD (n = 3); *p < .05 versus blank control; #p < .05.
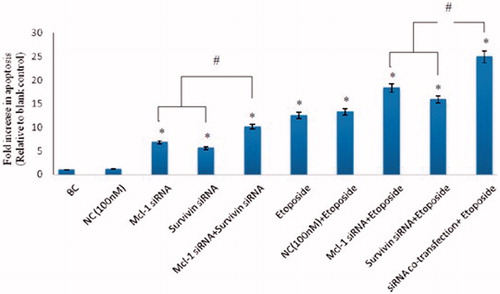
Table 2. Summarized inhibitory concentration (IC50) values of etoposide in MTT assay.
Figure 4. Flow cytometric apoptosis analysis of U-937 cells. Cells were stained with annexin-V-FITC and PI after treatment with blank control, 100 nM of NC siRNA, etoposide (IC50), 50 nM of Mcl-1 siRNA +50 nM of survivin siRNA and 50 nM of Mcl-1 siRNA +50 nM of survivin siRNA + etoposide (IC50). Dot plots are representative of three experiments.
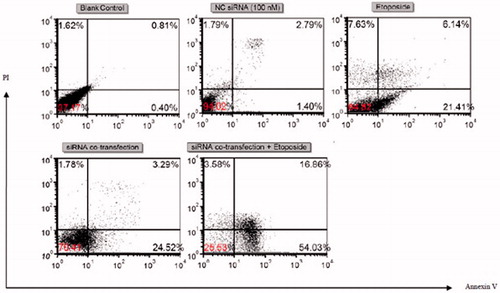
Table 3. Flow cytometric results of U-937 cells treated with anticancer agents.