Figures & data
Figure 1. The structure of CD133-DTX LP (A) and the transmission electron microscope of DTX LP (B) and CD133-DTX LP (C) (×97,000).
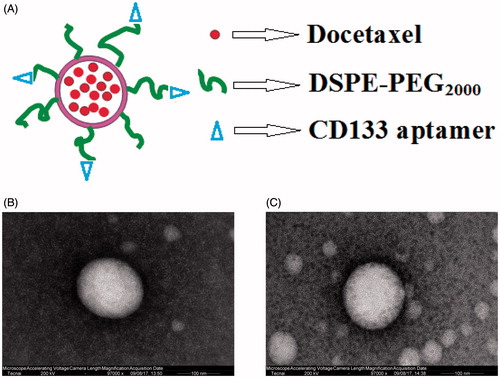
Table 1. The characteristics of different formulations: particle size, entrapment efficiency, polydispersity index and zeta potential (n = 3).
Figure 2. The release profile of free DTX (top line), DTX LP (middle line) and CD133-DTX LP (bottom line) (n = 6).
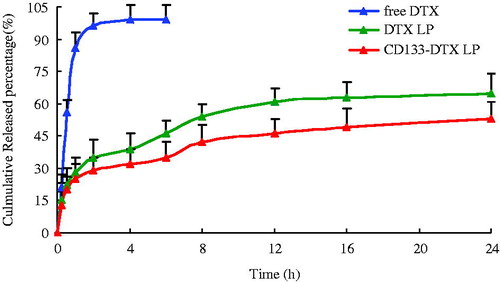
Table 2. Physical stability of CD133-DTX LP at 2–8 °C (n = 3).
Figure 3. Confocal images of cellular uptake of free DTX (A), DTX LP (B) and CD133-DTX LP (C) by a 549 cells. Incubation time was 2 h.
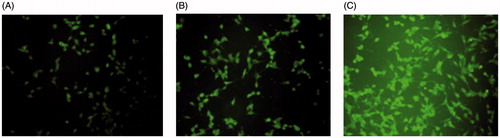
Figure 4. In vitro cytotoxicity analysis of free DTX, DTX LP and CD133-DTX LP on A549 cell lines. Cell viability assay was performed by MTT assay.
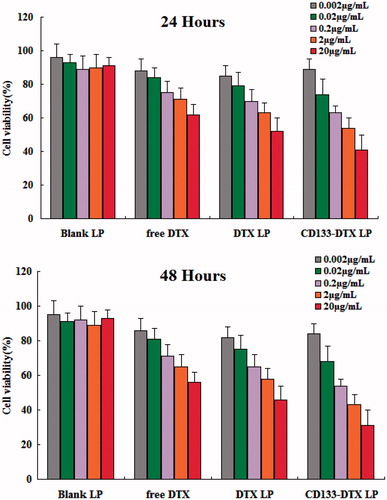
Figure 5. Fluorescence images of subcutaneous A-549 tumour-bearing nude mice after intravenous injection of DTX LP and CD133-DTX LP. The circle, the position of the tumour. (A) 2 h after injection. (B) 8 h after injection. (C) Fluorescence image of dissected organs of mice bearing A-549 tumour sacrificed 10 h after intravenous injection. 1, brain; 2, heart; 3, liver; 4, spleen; 5, lung. (D) Fluorescence image of dissected tumours of mice 10 h after intravenous injection of DTX LP and CD133-DTX LP.
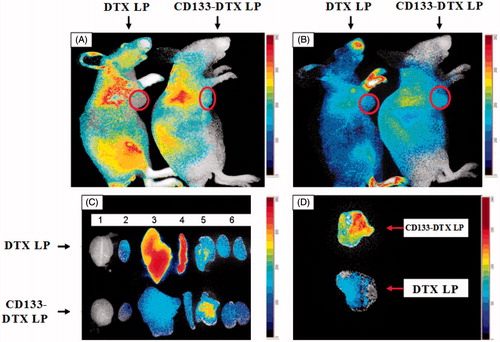
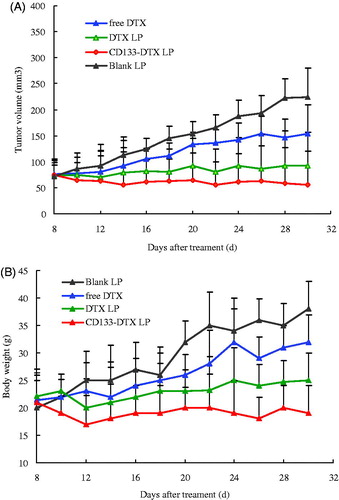
Figure 6. (A) A549 xenograft tumour growth inhibition by DTX in different formulations. (B) Animal body weights. The body weights of treated animals were continuously monitored to investigate systemic cytotoxicity of DTX in different formulations. Data = mean ± SD (n = 8).