Figures & data
Table 1. Coded independent and dependent variables with their lower and higher limit.
Table 2. Box–Behnken experimental design of SMV-loaded NLC and evaluated response parameters (n = 3).
Figure 1. Solubility of simvastatin in (A) liquid lipids (B) solid lipids.
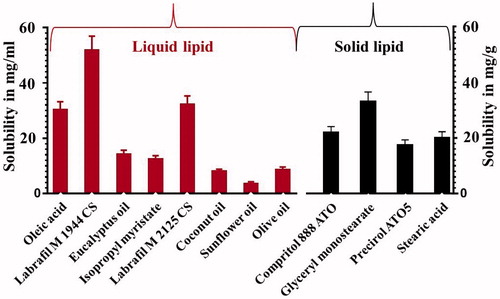
Table 3. Transmittance of NLC formulations produced by different surfactants (n = 3).
Table 4. ANOVA Results for responses Y1, Y2 and Y3 obtained from experimental design response.
Figure 2. 3 D-response surface plots showing effect of independent variables on (A) Particle size, (B) PDI and (C) entrapment efficiency.
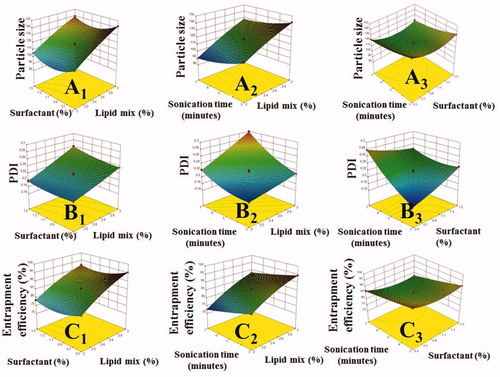
Figure 3. Linear correlation plots (A, C, E) between actual and predicted values and the corresponding residual plots (B, D, F) for particle size, PDI and entrapment efficiency.
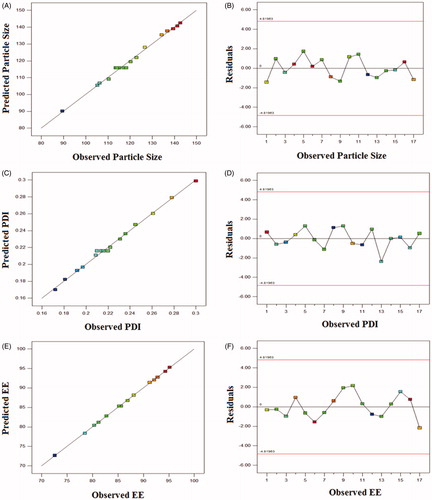
Table 5. Optimized levels of independent variables and their corresponding predicted and observed responses.
Figure 4. Representative particle size distribution graph of optimized SMV-NLC.
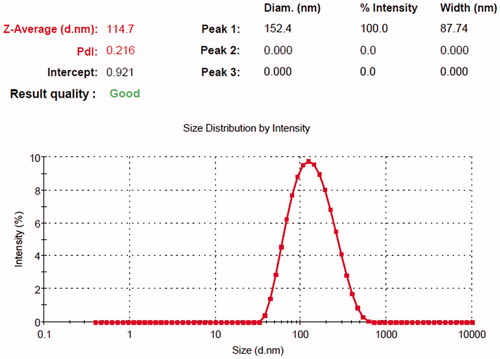
Figure 5. (A) TEM image and (B) SEM image of optimized drug-loaded NLC formulation.
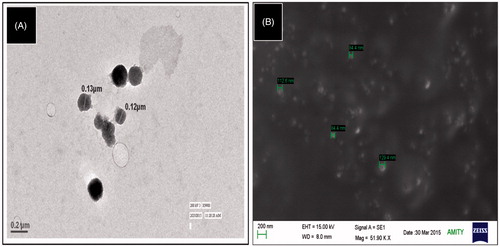
Figure 6. DSC thermogram of (A) SMV (B) blend of GMS and poloxamer 188 (C) Lyophilized SMV-NLC.
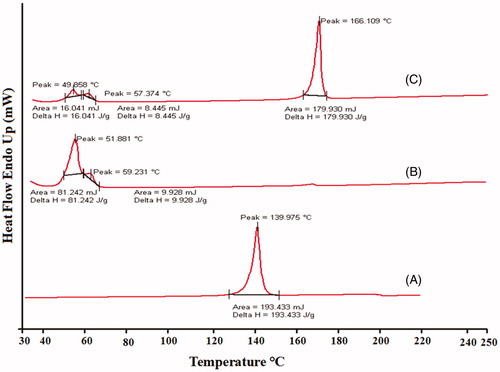
Figure 7. FT-IR spectra of (A) SMV, (B) physical mixture (SMV, poloxamer 188, GMS) and (C) SMV-loaded optimized NLC formulation.
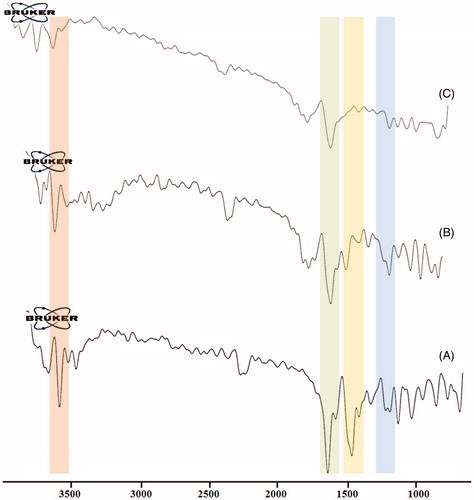
Figure 8. Comparative in vitro release profile of API suspension and SIM-NLC.
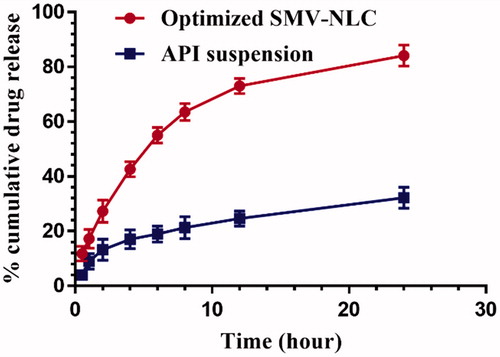
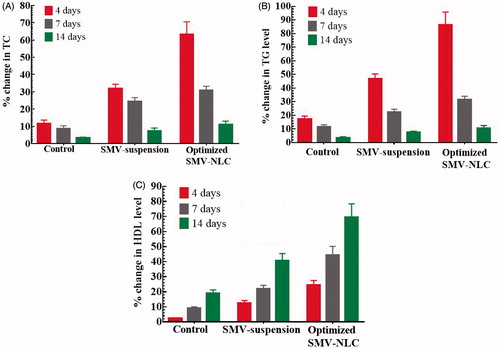
Figure 9. (A) Percentage change in total serum cholesterol level at different time intervals. (B) Percentage change in serum TG level at different time intervals. (C) Percentage change in HDL level at different time intervals.