Figures & data
Figure 1. Transmission electron microscope images (a and b), Brunauer-Emmet-Teller analysis (b) and small-angle X-ray diffraction (SAXRD) patterns (c) showing the mesoporous structures of MBG. (b is enlarged view of the boxed area in panel a). STP: standard temperature and pressure
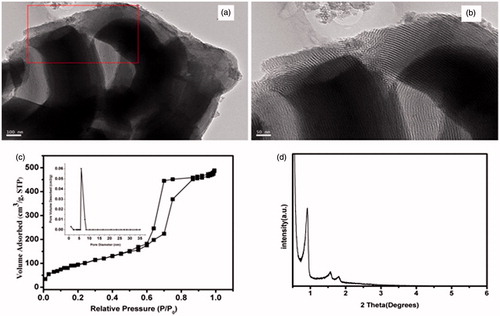
Figure 2. Scanning electron microscope images of pure PLGA (a1–a3), MBG/PLGA (b1–b3) and van-MBG/PLGA (c1–c3) scaffolds.
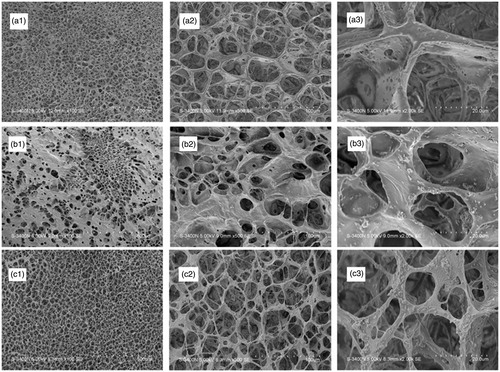
Figure 3. Water contact angles and surface energy measured on the surface of the scaffolds (a: PLGA; b: MBG/PLGA and c: Van-MBG/PLGA).
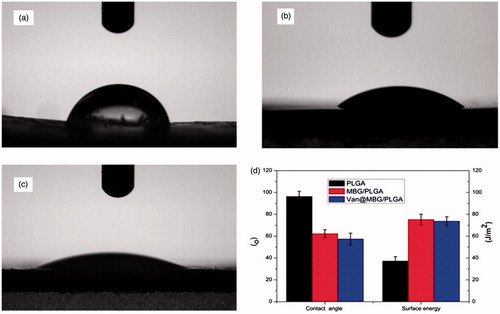
Figure 4. Results of in vitro degradation of PLGA and BMG/PLGA scaffold. Changes in ion concentration of the immersion extract during scaffolds soaking (a: Si; b: Ca and c: P); Change in pH levels of the immersion extract (d) and weight loss ratio from the scaffolds (e).
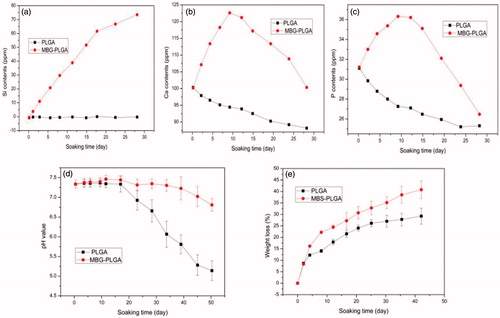
Figure 5. In vitro vancomycin release behavior of the MBG (a) and scaffolds (b) incubated in PBS with a pH of 7.3 at 37 °C.
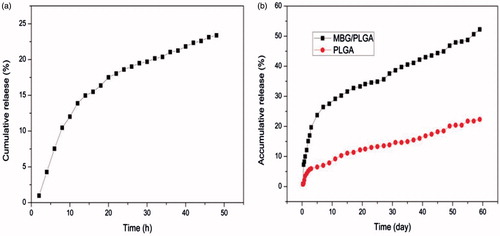
Figure 6. Attachment of the human mesenchymal stem cells on the different surfaces of the scaffolds. (a: PLGA; b:MBG/PLGA and c: Van-MBG/PLGA). (d) The proliferative tendency of the human mesenchymal stem cells at days 3, 7 and 14. *p < .05 compared with PLGA group; **p < .01 compared with PLGA group.
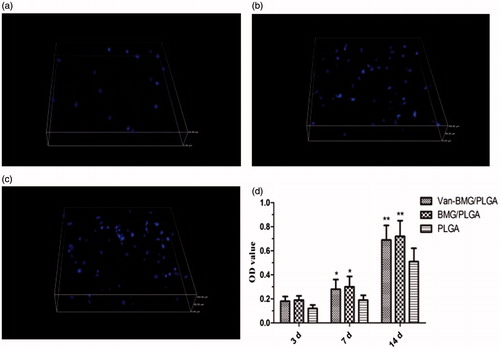
Figure 7. Cytoskeletal morphology and spreading of the human mesenchymal stem cells on the different scaffolds after four days (a: PLGA; b: MBG/PLGA and c: Van-MBG/PLGA). Representative images of cells stained with fluorescein isothiocyanate-phalloidin for actin filaments and nuclei counterstained with 4′,6′-diamidino-2-phenylindole.
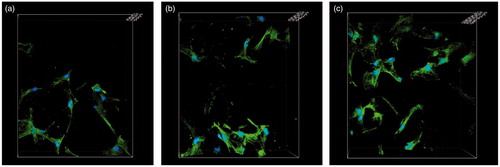
Figure 8. Evaluation of osteogenic differentiation. (a) In vitro ALP activity of hBMSCs cultured on the scaffolds for 3, 7 and 14 days. (b,c) RT-PCR analysis of osteogenesis-related genes expressions by hBMSCs on days 7 and 14. *p < .05 compared with PLGA group; **p < .01 compared with PLGA group.
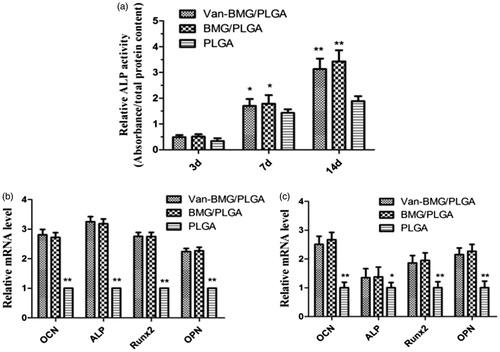
Figure 9. Evaluation of bacterial adhesion and biofilm formation. (a) The number of viable bacterial colonies after bacteria dissociation from the various scaffolds using the spread plate method. (b) Absorption of crystal violet was used to estimate the biofilm formation by ATCC35984 on the scaffolds. *p < .01 compared with van-BMG/PLGA group.
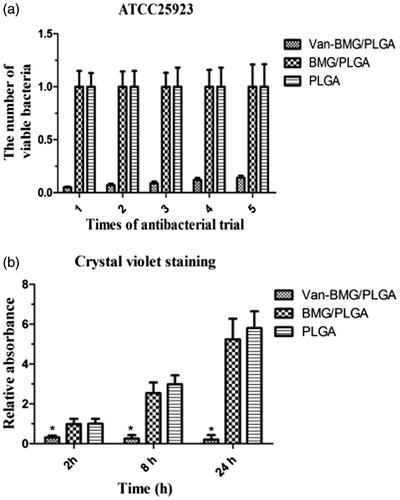
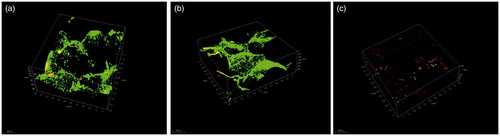
Figure 10. Three-dimensional images of bacterial viability and biofilm formation of S. aureus (ATCC25923) on the surfaces of PLGA (a), MBG/PLGA (b) and Van-MBG/PLGA (c) scaffolds at 24 h of culture obtained using confocal laser scanning microscopy after the BacLight dead/live staining.