Figures & data
Table 1. Primers used for real-time PCR.
Figure 1. EB formation. Formation of EBs with serial dripping. Each drop of culture medium contained ∼2 − 5×10 cells, which congregated and developed into an EB.
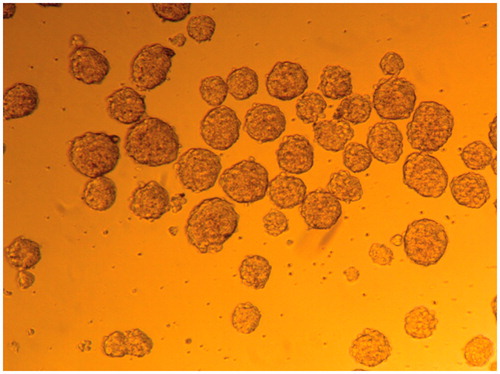
Figure 2. SEM imaging. Morphology of fabricated PES scaffold (A) Morphology of IPSC without differentiation (B and C) chondrogenic differentiated IPSC on nanofibrous PES (D and E).
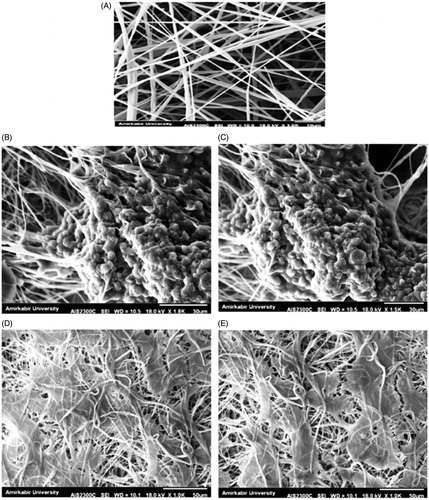
Figure 3. Proliferation of IPSC on TCPS and scaffold during a 24, 48, 76 and 96 h culture period, Results are presented as mean ± SD. Significant levels are *p < .05 and **p < .001.
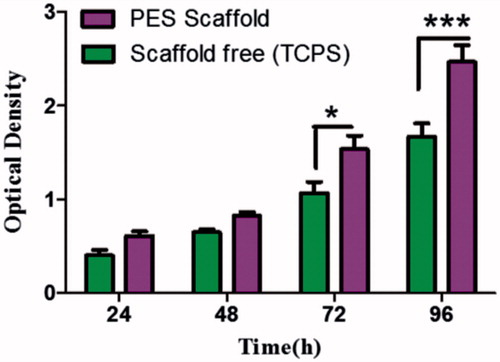
Figure 4. In vitro expression analysis of collagen type II and aggrecan markers on PES Scaffold. Immunofluorescence for collagen type II (A) and aggrecan markers (B) in chondrogenic differentiated IPSC after 21 d of in vitro differentiation. Staining of nucleus was performed by DAPI (blue), scale bars are 100 μm.
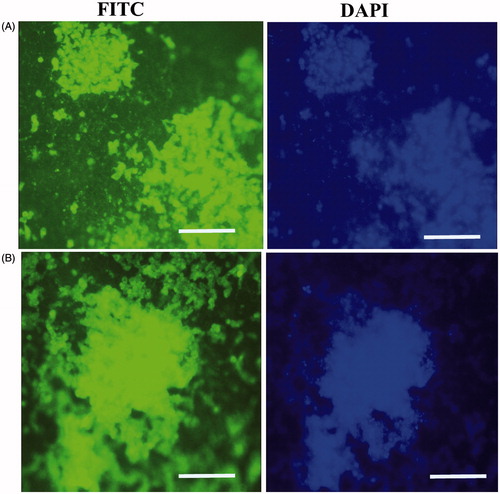
Figure 5. In vitro expression analysis of collagen II and aggrecan markers on the scaffold free method after 21 d. Type II collagen (A), and aggreacan (B), scale bars are 100 μm. Staining of nucleus was performed by DAPI (blue), scale bars are 100 μm.
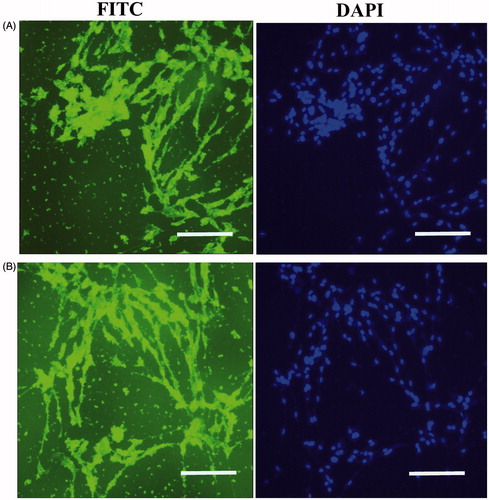
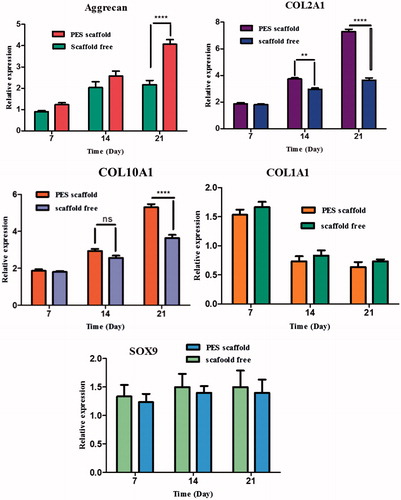
Figure 6. Expression of cartilage-specific genes. Relative expression of aggrecan, collagen I, collagen II, collagen X and SOX9 in IPSC cultured on PES scaffold during chondrogenic differentiation compared to scaffold free method. The expressions of collagen II, collagen X and aggrecan genes were significantly upregulated in PES scaffold compared to that in scaffold free method. Collagen type I expression was down regulated at the end of cultivation and also, SOX9 gene expression did not show a significant difference during chondrogenic differentiation of IPSC on both scaffolds. Results are presented as mean ± SD. Significant levels are **p < .01, ***p < .001 and ****p < .0001.