Figures & data
Table 1. Design of scaffolds with different volumetric ratios.
Figure 1. Swelling (A), dissolve–loss tests (B), porosity (C), mechanical property (D) and cell proliferation (E) of different proportions of composite scaffolds. The values are the means and standard deviations (n = 3, *p < .05, **p < .01, ***p < .001).
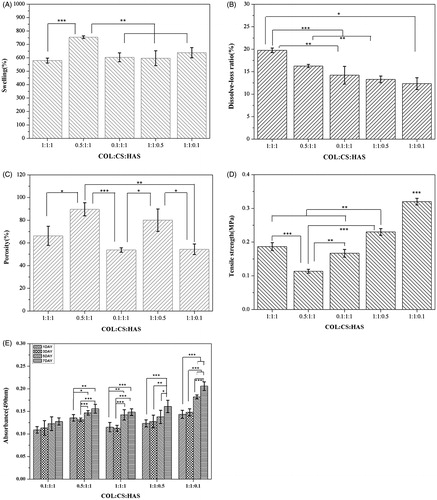
Figure 2. SEM images of the samples: (A) PLGA MPs loaded with KGN (bar = 30 μm). (B) Fracture surface of COL/CS/0.1HAS (bar = 300 μm). (C) Fracture surface of scaffolds/MPs. The arrows indicate the MPs (bar = 100 μm).
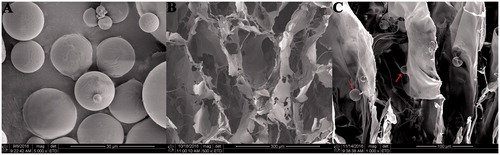
Figure 3. FTIR spectra of COL, CS and HAS and composite scaffolds before and after cross-linking.
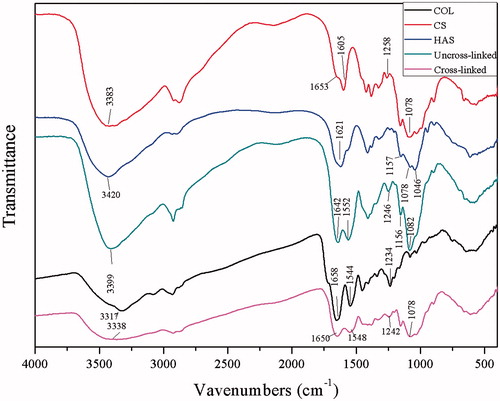
Figure 4. BMSCs were stained with AO/EB and Hoechst 33342. BMSCs in the leach liquor of scaffolds/MPs were stained with AO/EB cultured at (A) 3 days, (B) 5 days and (C) 7 days. BMSCs in scaffolds/MPs were stained with AO/EB and cultured at (D) 3 days, (E) 5 days and (F) 7 days. BMSCs in scaffolds/MPs were stained with Hoechst 33342 and cultured at (G) 3 days, (H) 5 days and (I) 7 days. The arrow indicates PLGA MPs (bar =100 μm).
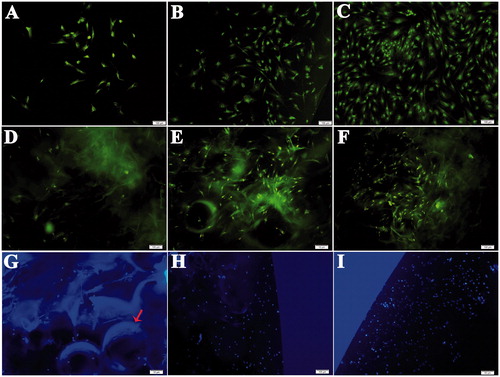
Figure 5. Cell proliferation (A) in the scaffolds and scaffolds/MPs was assessed by the CCK-8 kit. Cell adhesion (B,C) on the scaffolds/MPs was assessed by SEM. The right arrow indicates MPs, and the left arrow indicates BMSC. The values are the means and standard deviations (n = 6, **p < .01, ***p < .001).
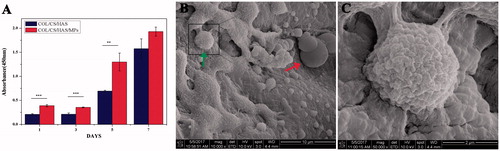
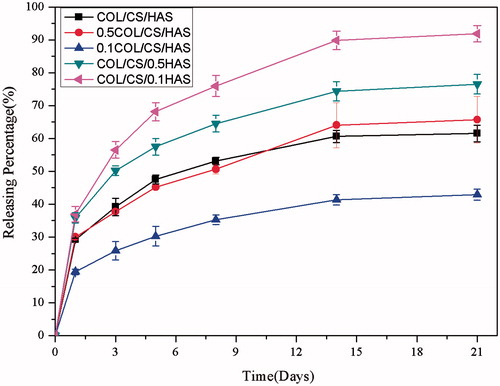
Figure 6. In vitro release profiles of KGN from scaffolds/MPs. The values are the means and standard deviations (n = 3).