
Figures & data
Figure 1. TEM image of the synthesized FA-AuNPs, suggesting that the nanoparticles are well dispersed and appear to be spherical in shape with a size distribution of 10–30 nm.
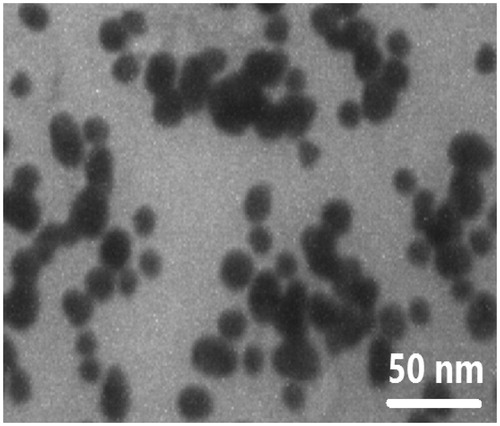
Figure 2. (a) Size distribution of the synthesized FA-AuNPs (peak: 33.8 nm). (b) Zeta potential distribution of the synthesized FA-AuNPs (peak: −12.5 mV).
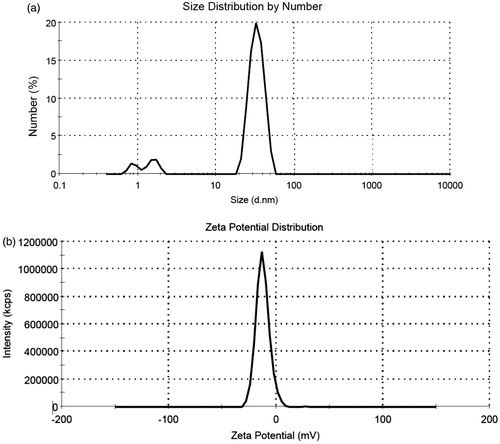
Figure 3. UV–visible spectrum of AuNPs with and without conjugation with folic acid [Reprinted with permission from Elsevier].
![Figure 3. UV–visible spectrum of AuNPs with and without conjugation with folic acid [Reprinted with permission from Elsevier].](/cms/asset/bda7d00b-8bdf-40e6-a23c-ada235403a1a/ianb_a_1408019_f0003_c.jpg)
Figure 4. FTIR spectra of folic acid, AuNPs stabilized with trisodium citrate and FA-AuNPs [Reprinted with permission from Elsevier].
![Figure 4. FTIR spectra of folic acid, AuNPs stabilized with trisodium citrate and FA-AuNPs [Reprinted with permission from Elsevier].](/cms/asset/076a8f69-1660-4f21-ae34-edc7a1f50321/ianb_a_1408019_f0004_c.jpg)
Figure 5. The viability of KB cells after 12-h incubation with AuNPs and FA-AuNPs at different concentrations.
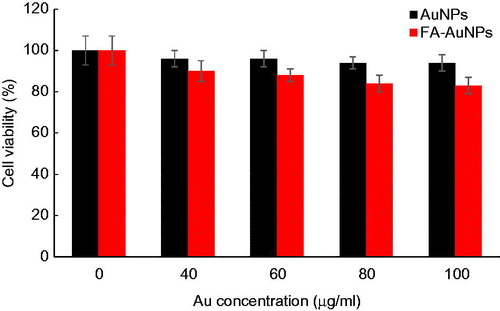
Figure 6. The CT values of KB cells treated with AuNPs and FA-AuNPs (12 h) at different concentrations (tube voltage of 130 kVp and tube current–time product of 60 mAs).
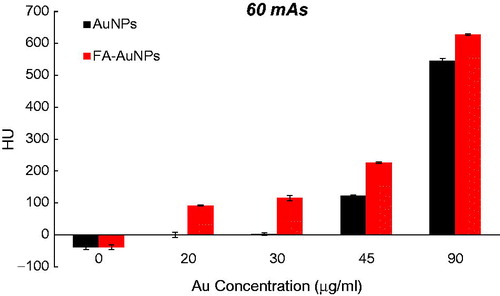
Figure 7. The CT values of KB cells treated with AuNPs and FA-AuNPs (12 h) at different concentrations (tube voltage of 130 kVp and tube current–time product of 90 mAs).
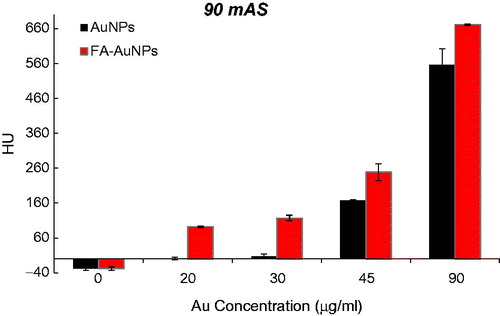
Figure 8. The CT values of KB cells treated with AuNPs and FA-AuNPs (12 h) at different concentrations (tube voltage of 130 kVp and tube current–time product of 120 mAs).
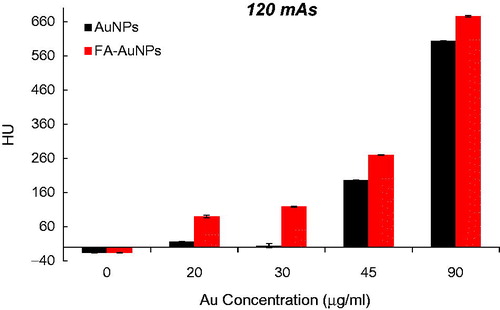
Figure 9. The CT values of KB cells treated with AuNPs and FA-AuNPs (12 h) at different concentrations (tube voltage of 130 kVp and tube current–time product of 160 mAs).
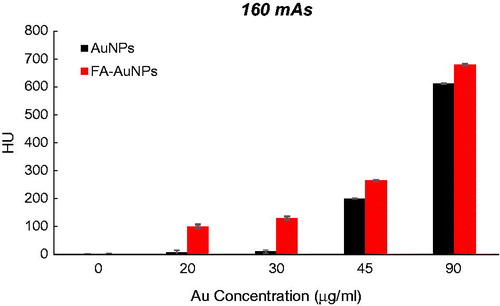
Figure 10. The CT values of KB cells treated with AuNPs and FA-AuNPs (12 h) at different concentrations (tube voltage of 130 kVp and tube current–time product of 250 mAs).
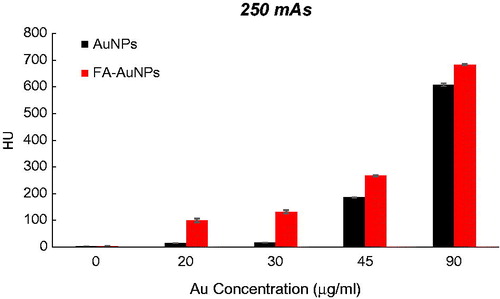
Figure 11. The CTDI values measured from the CT scanning of a head phantom at different mAs products and fixed peak tube voltage of 130 kVp.
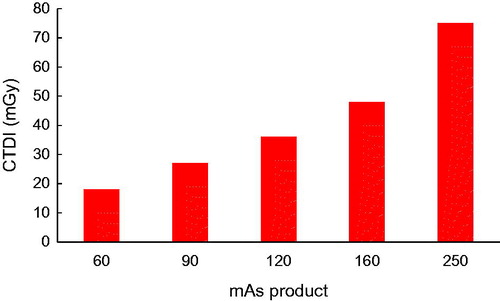
Table 1. The resultant increase in the CT value of KB cells caused by the FA modification of AuNPs (ΔHU FA-AuNPs – ΔHU AuNPs). ΔHU FA-AuNPs and ΔHU AuNPs stand for the increase in the CT value of KB cells due to treatment with FA-AuNPs and AuNPs at the same Au concentration relative to the CT value of the control group, respectively.
Table 2. The effects of elevating the mAs product, AuNPs and FA-AuNPs on the CT value enhancement of KB cells. ΔHU stands for the resultant increase in the CT value of KB cells due to the mentioned effects relative to the control group.