Figures & data
Figure 1. Morphology of nanocapsules containing selol and doxorubicin (NCS-DOX) assessed by scanning electron microscopy (SEM), in two different magnifications, 33,000× and 22,000×, as indicated in the electronmicrographs.
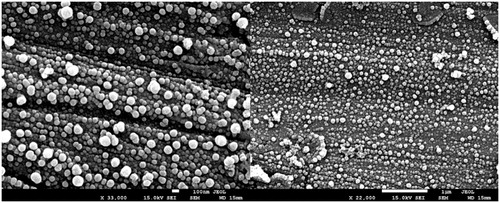
Table 1. Hydrodynamic diameter (HD, z-average), polydispersity index (PDI) and zeta potential (ZP) of nanocapsules. Values are expressed as mean ± standard error of the mean.
Figure 2. FTIR spectra (left) of PVM/MA, DOX (doxorubicin), Pol-DOX (reaction product of PVM/MA and doxorubicin) and NCS-DOX (nanocapsules containing selol and doxorubicin). The graph on the right presents SERS spectra of DOX, Pol-DOX and NCS-DOX.
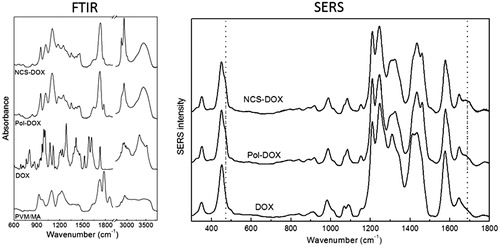
Figure 3. Schematic representation of NCS-DOX (nanocapsules containing selol and doxorubicin), with carboxylate groups in blue and the doxorubicin residue in red (color figure online).
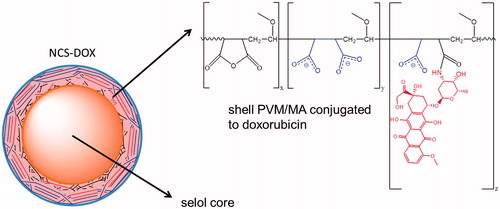
Figure 4. Doxorubicin release profile from a dialysis bag containing NCS-DOX (nanocapsules containing selol and doxorubicin) or doxorubicin alone (free DOX) in PBS.
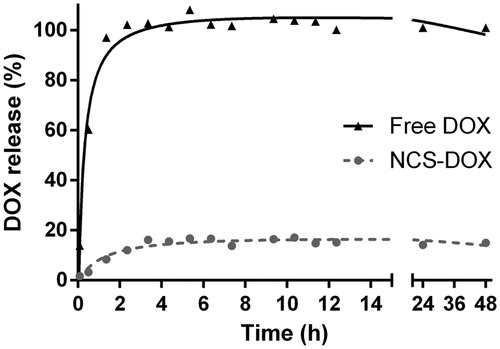
Figure 5. Images of confocal laser scanning of the 4T1 cells treated with DOX (doxorubicin alone), NCS-DOX or Pol-DOX, 9 µg DOX/mL for 6 h. Results of colocalization intensities are presented on the graph in the right bottom side. Nuclei were labelled with DAPI (blue), endoplasmic reticulum with ER-Tracker® (blue, ER), lysosomes with LysoTracker® (blue, LYSO) and mitochondria with MitoTracker® (green, MITO). DOX appears in red. Images were processed with Adobe Photoshop CC 2015 software (Adobe Systems Incorporated, San Jose, CA). Different letters above the columns in a single treatment indicate a statistically significant difference (p < .05). *p < .05 vs. same organelles in NCS-DOX and Pol-DOX (color figure online).
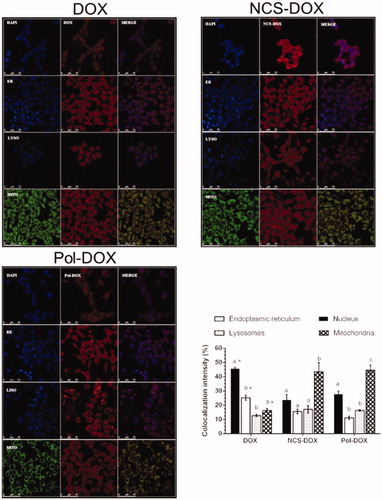
Figure 6. Confocal Raman analyses: (a) Raman spectra of selol (red) and NCS-DOX (black). Characteristic Raman peaks of selenium, doxorubicin and Selol are denoted. (δ: deformation; ν: stretching; ω: wagging). (b) Confocal Raman imaging of 4T1 cells exposed to NCS-DOX over 6 h (left) and control 4T1 cells (right). The color-coded images represent the overlapping of lipids, DNA/RNA, cytoplasm, as well as doxorubicin and NCS-DOX (color figure online).
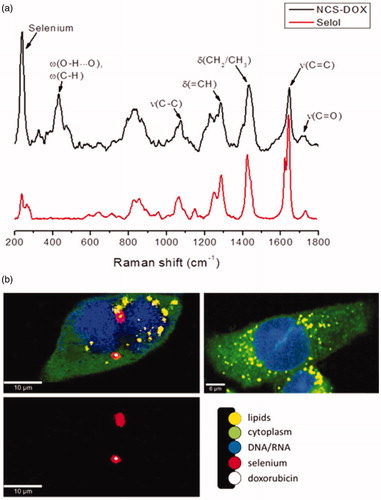
Figure 7. Interiorization of NSC-DOX NPs in 4T1 cells. (a) Raman x–y area imaging of protein/lipid distributions displaying the uptake pattern of NCS-DOX in cytoplasm; white line indicates the range of x-coordinate in the x–z depth scan. (b) The color-coded image (left) of an x–z depth scan represents the overlapping of cytoplasm, lipids and selenium (right) within a single cell. (c) Raman spectra collected at different z-positions along the blue line (image b) (color figure online).
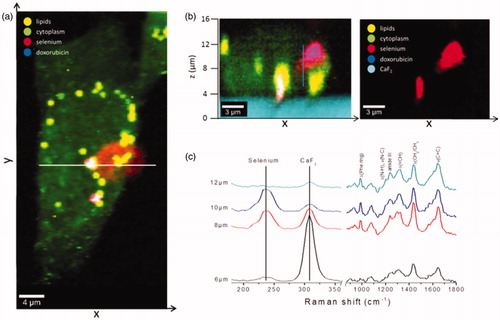
Figure 8. Ion beam microscopy analyses: (a) µPIXE spectra of control cells and 4T1 cells exposed to NCS-DOX NPs over 6 h; characteristic K – X-ray lines of the cellular elements and selenium element are labelled. (b) µPIXE images of phosphor, sulphur and selenium distribution pattern in a 4T1 cell exposed to NCS-DOX NPs over 6 h; the green line denotes the selected region of interest (color figure online).
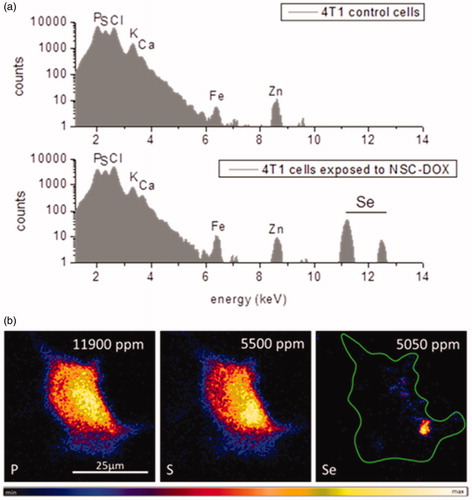
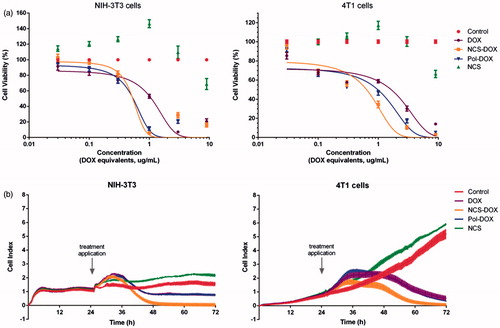
Figure 9. Effects of treatments on the viability and adhesion of NIH-3T3 and 4T1 cells: (a) viability of cells exposed to NCS-DOX (nanocapsules containing selol and doxorubicin), NCS (nanocapsules of selol), Pol-DOX (only PVM/MA conjugated to doxorubicin) and DOX (doxorubicin alone) for 48 h, evaluated by the MTT method. (b) Cell adhesion indexes of NIH-3T3 and 4T1 cells continuously monitored in real time for 72 h; cells were treated at 24 h with NCS-DOX, NCS, Pol-DOX or DOX at concentrations equivalent to 1 μg DOX/mL. The control was exposed only to the culture medium. Data are expressed as mean ± standard error of the mean.