Figures & data
Table 1. The primer sequences of the tested genes.
Figure 1. Schematic illustration of green synthesis of P-AgNPs and P-AuNPs from P. serrulata fresh fruits extract and its applications on inflammatory cells with outlined detailed mechanism.
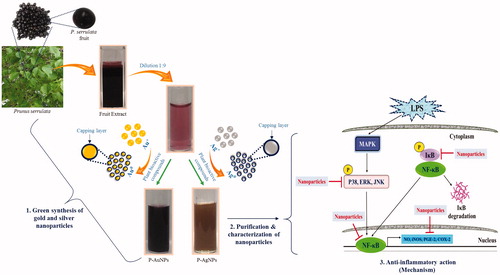
Figure 2. Visible colour observation of reaction mixture and control for P-AgNPs (A) and P-AuNPs (B), respectively. UV–vis spectra showing maximum absorbance at 440 nm P-AgNPs (C) and 558 nm for P-AuNPs (D).
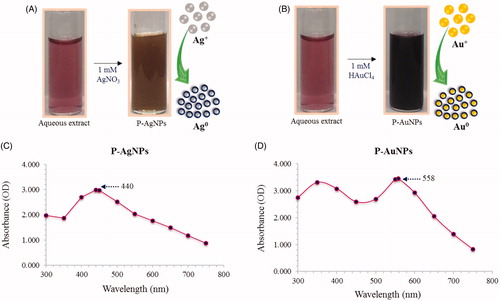
Figure 3. FE-TEM image of spherical shape P-AgNPs (A, B) and hexagonal shape P-AuNPs (C, D). Elemental mapping of P-AgNPs, electron micrograph image and respective silver elements distribution (E, F). Elemental mapping of P-AuNPs electron micrograph image and respective gold elements distribution (G, H). EDX spectrum of P-AgNPs (I) and P-AuNPs (J), respectively.
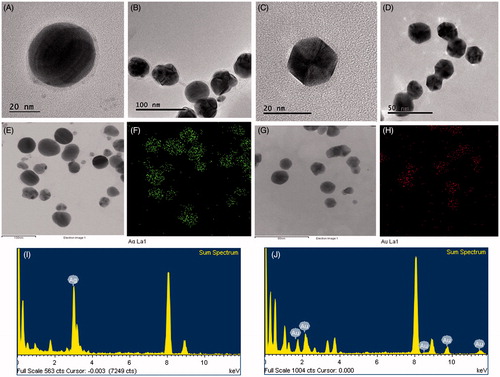
Figure 4. XRD spectrum and SEAD pattern of P-AgNPs (A), and P-AuNPs (B), showing crystalline nature of nanoparticles.
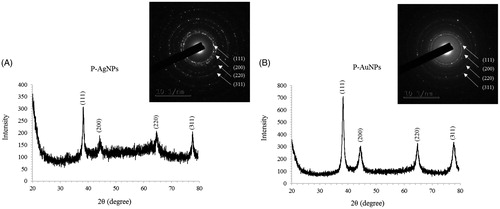
Figure 5. FT-IR profile of P-AgNPs and plant (fruit) extract (A), P-AuNPs and plant (fruit) extract (B), respectively.
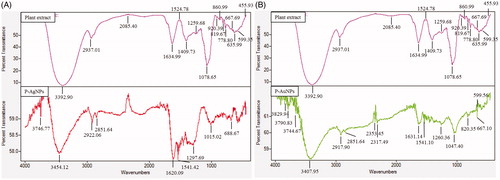
Figure 6. Particle size distribution of P-AgNPs (A), and P-AuNPs (B), with respect to intensity, number and volume distributions of nanoparticles.
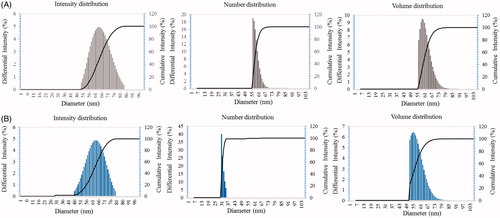
Figure 7. Effects of P-AgNPs (A) and P-AuNPs (B) on cell viability respectively. For cell viability assay, RAW264.7 cells were incubated for 24 h with various concentrations of P-AgNPs (1–100 μg/ml) and P-AuNPs (1–200 μg/ml).
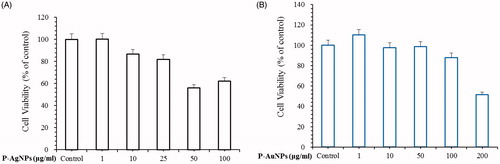
Figure 8. Effects of P-AgNPs and P-AuNPs on the production of NO (A) and PGE2 (B). Macrophages RAW264.7 cells were pre-treated both samples for 1 h, and then stimulated with LPS (1 μg/mL) for 24 h. The concentrations of Nitrite and PGE2 were determined as described in the materials and methods. Data shown represent the mean values of three experiments ± SD. ***p < .001as compared to the group treated with LPS.
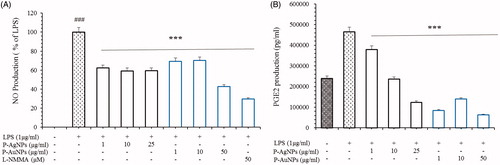
Figure 9. Effects of P-AgNPs and P-AuNPs on iNOS and COX-2 activation. RAW264.7 cells were pre-treated with the indicated concentrations of both samples for 1 h, and then stimulated with LPS (1 μg/mL) for 24 h. Subsequently, total RNAs were extracted and the mRNA expression levels iNOS and COX-2 were determined by RT-PCR analysis and compared with those of β-actin (A, B and C). Total protein levels of iNOS and COX-2 in whole lysates from LPS-activated RAW264.7cells were determined by western blot analysis (D). The data shown are representative of mean values of three independent experiments ± SD. ***p < .001 as compared to the group treated with LPS and ###p < .001 as compared to the LPS-treated cells.
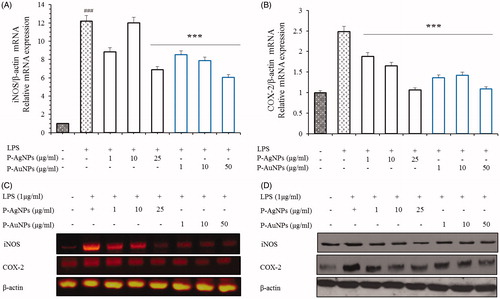
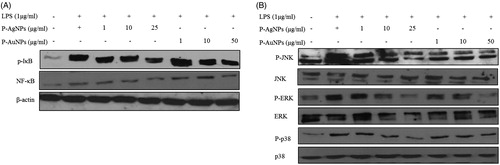
Figure 10. Effect of P-AgNPs and P-AuNPs on LPS-induced NF-κB and MAPK phosphorylation. RAW264.7 cells cultures stimulated with LPS (1 μg/ml) in the absence or presence of P-AgNPs and P-AuNPs. Whole cell lysates were subjected to Western blot analysis using antibodies against phosphorylation of IκB, NF-κB (A) and MAPK (B) compared with those of β-actin.