
Figures & data
Table 1. Various independent and dependent variables used in the Box–Behnken design for preparation of SFN-loaded NLCs.
Figure 1. Solubility of SFN in different (A) liquid lipids, and (B) solid lipids.
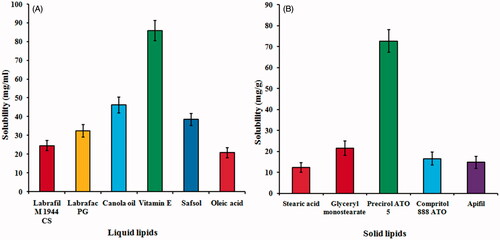
Figure 2. Three dimensional (3D) response surface plots showing simultaneous influence of independent variables on response parameters: (A) particle size, (B) entrapment efficiency and (C) drug loading of SFN-loaded NLC formulated within Box–Behnken experimental design.
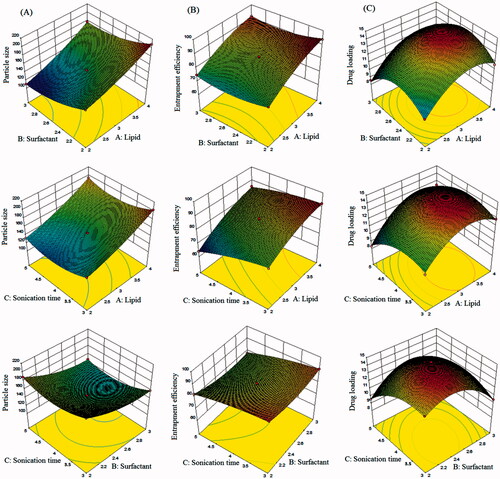
Figure 3. Linear correlation plots between actual and predicted values and the corresponding residual plots for (A) particle size, (B) entrapment efficiency and (C) drug loading.
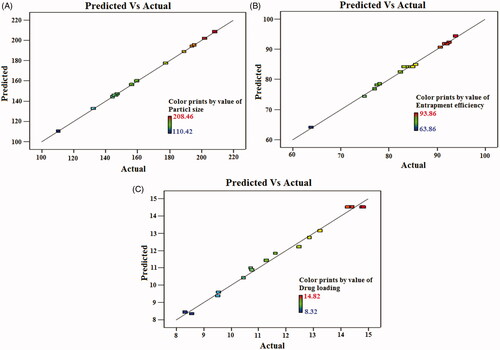
Table 2. Observed Box–Behnken experimental runs of SFN-loaded NLCs with their actual and predicted experimental value of Y1 (particle size), Y2 (entrapment efficiency) and Y3 (drug loading).
Table 3. Summary of regression analysis for responses Y1 (particle size in nm), Y2 (entrapment efficiency in %) and Y3 (drug loading in %) for fitting data to different models.
Figure 4. Image showing (A) particle size and particle size distribution, (B) zeta potential and (C) TEM analysis of optimized SFN-loaded NLC formulation.
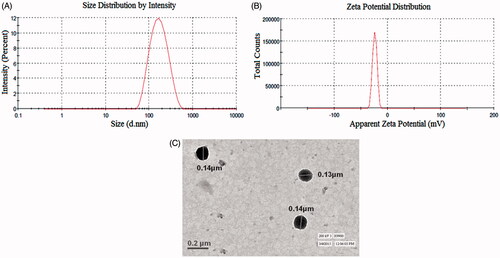
Figure 5. FT-IR spectra of (A) SFN, (B) Precirol® ATO 5 and (C) SFN-loaded optimized NLC formulation.
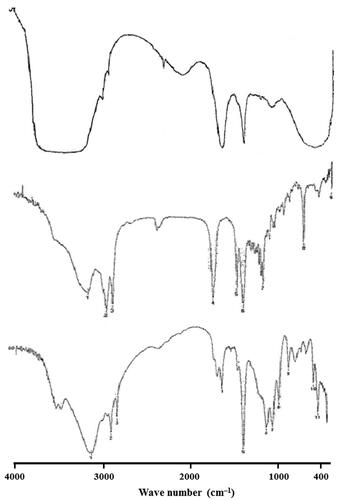
Figure 6. Image showing (A) in vitro drug release profile of plain SFN solution, and optimized SFN-loaded NLC formulation and (B), (C), (D) and (E) represents the release kinetics models for optimized SFN-loaded NLC formulation.
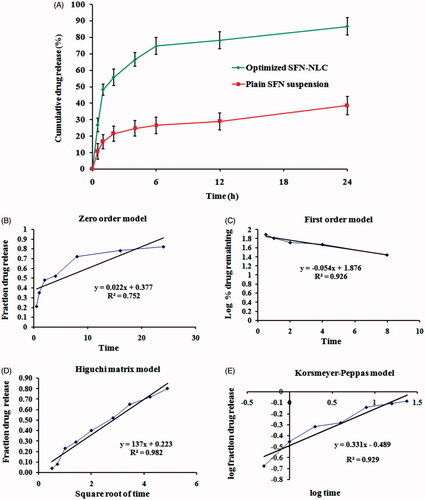
Table 4. In vitro release models fitting in terms of linear regression coefficient (R2).
Table 5. Stability data of the optimized SFN-loaded NLC formulation at 25 °C ± 2 °C/65% ± 5% RH and 40 °C ± 2 °C/75% ± 5% RH for 90 days (n = 3).
Figure 7. Ex vivo gut permeation study showing: (A) cumulative amount of drug permeated (µg) versus time, (B) Cumulative drug transported (µg cm−2) versus time, and (C) Papp (ACP) for plain SFN solution and optimized SFN-loaded NLC formulation. Image (D) and (E) represents confocal laser scanning microscopic image of gut treated with plain rhodamine B solution, and optimized NLC formulation containing rhodamine B, respectively.
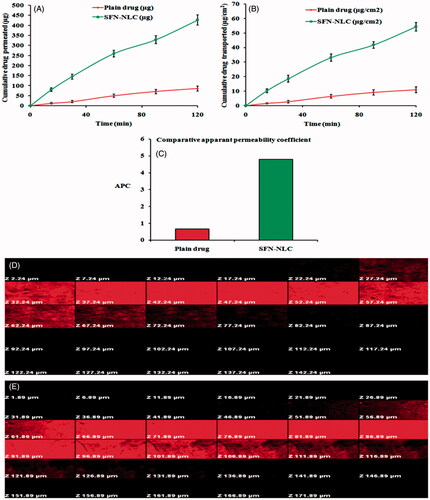
Figure 8. Image showing MTT assay for placebo NLC formulation, plain SFN solution and optimized SFN-loaded NLC formulation with (A) MCF-7 human lung adenocarcinoma cancer cells, (B) B16-F10 murine melanoma cells and (C) SW620 human Caucasian colon adenocarcinoma cells. Image (D) represents DPPH and ABTS free radical scavenging assay of free SFN solution and optimized SFN-loaded NLC formulation. All data are mean ± SD (n = 3) with statistical difference at p < .05.
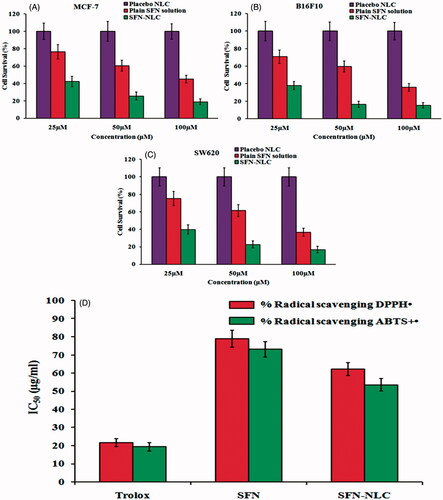
Figure 9. Plasma concentration–time profiles of SFN in rats after oral administration of optimized SFN-loaded NLC formulation and plain SFN suspension.
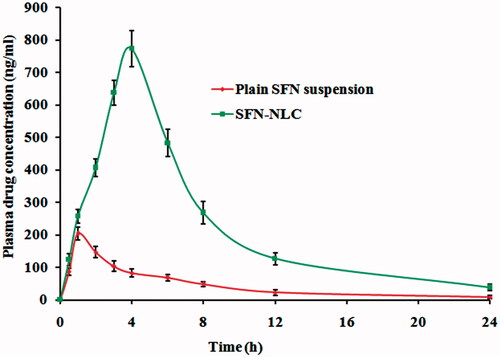
Table 6. Pharmacokinetic parameters of SFN in optimized NLC formulation and plain SFN suspension (n = 6, mean ± SD).