Figures & data
Table 1. Process variables and their levels for experimental design.
Table 2. Experimental runs obtained from Box–Behnken design and their observed value of particle size (Y1), drug loading (Y2) and %drug release (Y3).
Table 3. Summary of regression analysis for responses [Y1 = particle size (nm), Y2 = drug loading (%), and Y3 = drug release (%)] for fitting to different kinetic models.
Figure 1. (A–D) 3D-response surface plots and 2D contour plot showing the influence of independent variables [eudragit (%), tween 80 (%), and sonication time (minutes)] on particle size (nm) for the SIT-NPs.
![Figure 1. (A–D) 3D-response surface plots and 2D contour plot showing the influence of independent variables [eudragit (%), tween 80 (%), and sonication time (minutes)] on particle size (nm) for the SIT-NPs.](/cms/asset/bd529405-91ba-42b6-a734-12ec220e39a4/ianb_a_1411933_f0001_c.jpg)
Figure 2. (A–D) 3D-response surface plots and 2D contour plot showing the influence of independent variables [eudragit (%), tween 80 (%), and sonication time (minutes)] on drug loading (%) for the SIT-NPs.
![Figure 2. (A–D) 3D-response surface plots and 2D contour plot showing the influence of independent variables [eudragit (%), tween 80 (%), and sonication time (minutes)] on drug loading (%) for the SIT-NPs.](/cms/asset/5206b4fc-6ead-485c-80a0-6d083265d34b/ianb_a_1411933_f0002_c.jpg)
Figure 3. (A–D) 3D-response surface plots and 2D contour plot showing the influence of independent variables [eudragit (%), tween 80 (%), and sonication time (minutes)] on drug release (%) for the SIT-NPs.
![Figure 3. (A–D) 3D-response surface plots and 2D contour plot showing the influence of independent variables [eudragit (%), tween 80 (%), and sonication time (minutes)] on drug release (%) for the SIT-NPs.](/cms/asset/ac0c6a09-ed0e-48b3-8683-7c7f06f0c85a/ianb_a_1411933_f0003_c.jpg)
Figure 4. Predicted vs. actual plot showing the influence of independent variables [eudragit (%), tween 80 (%), and sonication time (minutes)] on dependent variables [particle size (nm), drug loading (%) and drug release (%)] for the SIT-NPs.
![Figure 4. Predicted vs. actual plot showing the influence of independent variables [eudragit (%), tween 80 (%), and sonication time (minutes)] on dependent variables [particle size (nm), drug loading (%) and drug release (%)] for the SIT-NPs.](/cms/asset/0e5fddb5-f98f-47fb-ad7b-9f8aba7e7189/ianb_a_1411933_f0004_c.jpg)
Table 4. Experimentally optimized value of formulation SIT-NPopt.
Figure 5. (A–D) Images of SIT-NPopt: (A) Particle size distribution image; (B) Transmission electron micrograph; (C) Scanning electron micrograph; (D) Atomic force microscopy.
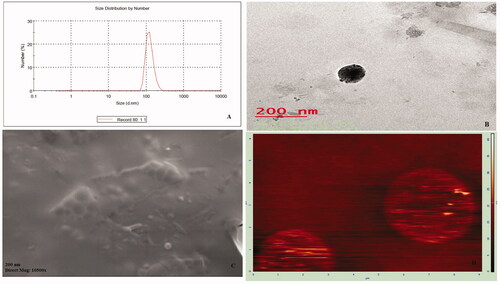
Figure 6. Comparative in-vitro drug release profile of SIT-NPopt and SIT-Fs.
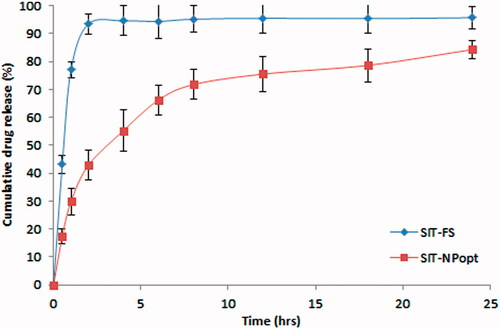
Table 5. In vitro release kinetics data to different mathematical models for SIT-NPopt and SIT-fs.
Figure 7. Comparative In-vivo antidiabetic activity profile of different treated groups on animal model.
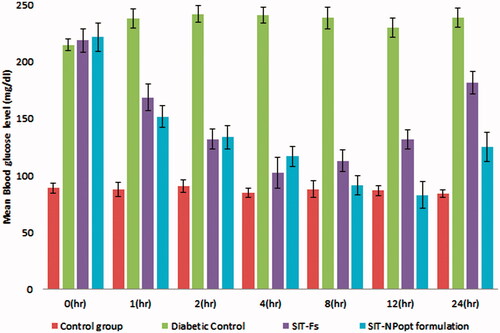
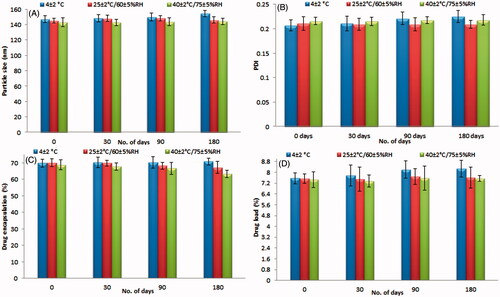
Figure 8. (A–D) Effect of different temperature with humidity on the stability study data of SIT-NPopt.