Figures & data
Figure 1. Scheme of solid phase peptide synthesis and final cleavage.
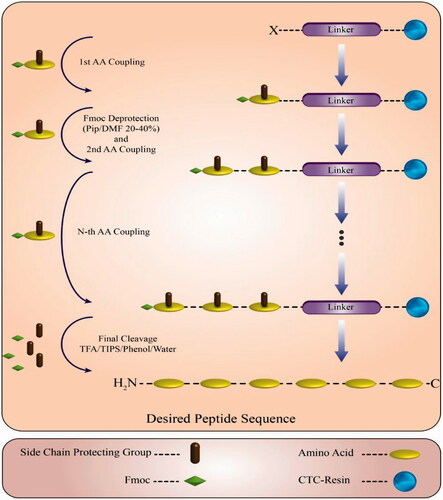
Table 1. Synthesized peptide sequences.
Figure 2. Toxicity of (a) modified peptides and (b) unmodified peptides to MCF-7 cells and (c) drug concentrations to calculate IC50. The cells were incubated for 24, 48 and 72 h at 37 ºC with concentrations of 25 and 50 µM, respectively for cell viability assessment by MTT. (i) (P1: BA-[WR]4-pGlu, P2: BA-QGR-[WK]3-pGlu, P3: BA-QGR-[WR]3-pGlu, P4: BA-[WR]3-QGR-pGlu, P5: BA-WRWQGRWRW-pGlu, P6: BA-R8-pGlu, P7: BA-R10-pGlu, P8: BA-K10-pGlu) and (ii) (P1: COOH-WRWQGRWRW-NH2, P2: COOH-QGR-[WR]3-NH2, P3: COOH-QGR-[WK]3-NH2, P4: COOH-[WR]3-QGR-NH2, P5: COOH-[WR]4-NH2).
![Figure 2. Toxicity of (a) modified peptides and (b) unmodified peptides to MCF-7 cells and (c) drug concentrations to calculate IC50. The cells were incubated for 24, 48 and 72 h at 37 ºC with concentrations of 25 and 50 µM, respectively for cell viability assessment by MTT. (i) (P1: BA-[WR]4-pGlu, P2: BA-QGR-[WK]3-pGlu, P3: BA-QGR-[WR]3-pGlu, P4: BA-[WR]3-QGR-pGlu, P5: BA-WRWQGRWRW-pGlu, P6: BA-R8-pGlu, P7: BA-R10-pGlu, P8: BA-K10-pGlu) and (ii) (P1: COOH-WRWQGRWRW-NH2, P2: COOH-QGR-[WR]3-NH2, P3: COOH-QGR-[WK]3-NH2, P4: COOH-[WR]3-QGR-NH2, P5: COOH-[WR]4-NH2).](/cms/asset/95b1d071-5370-498e-b1f8-4fcf8c14f4c5/ianb_a_1414823_f0002_c.jpg)
Figure 3. Cytotoxicity of (a) unmodified and (b) modified peptides interaction with MTX (physical linkage) and MCF-7 cells; (c) Cytotoxicity of unmodified peptides conjugated with MTX. The cells were incubated for 24, 48 and 72 h at 37 °C with concentrations of 25 and 50 nM, respectively for cell viability assessment by MTT. (i) (BA-WRWQGRWRW-pGlu, BA-QGR-[WK]3-pGlu), (ii) (COOH-QGR-[WK]3-NH2, COOH-[WR]3-QGR-NH2, COOH-WRWQGRWRW-NH2) and (iii) (COOH-QGR-[WK]3-MTX, COOH-WRWQGRWRW-MTX, COOH-[WR]4-MTX, COOH-[WR]3-QGR-MTX, COOH-QGR-[WR]3-MTX).
![Figure 3. Cytotoxicity of (a) unmodified and (b) modified peptides interaction with MTX (physical linkage) and MCF-7 cells; (c) Cytotoxicity of unmodified peptides conjugated with MTX. The cells were incubated for 24, 48 and 72 h at 37 °C with concentrations of 25 and 50 nM, respectively for cell viability assessment by MTT. (i) (BA-WRWQGRWRW-pGlu, BA-QGR-[WK]3-pGlu), (ii) (COOH-QGR-[WK]3-NH2, COOH-[WR]3-QGR-NH2, COOH-WRWQGRWRW-NH2) and (iii) (COOH-QGR-[WK]3-MTX, COOH-WRWQGRWRW-MTX, COOH-[WR]4-MTX, COOH-[WR]3-QGR-MTX, COOH-QGR-[WR]3-MTX).](/cms/asset/be82e282-fafc-44fa-9190-4c214e74e763/ianb_a_1414823_f0003_c.jpg)
Figure 4. Live cell images. Row (a) Bright field (40×): A (R8-FAM, 25 µM), D (R8-FAM/E8, 25 µM), G (Mem-R8-FAM, 50 µM) and J (Mem-R8-FAM/E8, 50 µM). Row (b) Fluorescent (40×): B (R8-FAM, 25 µM), E (R8-FAM/E8, 25 µM), H (Mem-R8-FAM, 50 µM) and K (Mem-R8-FAM/E8, 50 µM). Row (c) Merged: C (R8-FAM, 25 µM), F (R8-FAM/E8, 25 µM), I (Mem-R8-FAM, 50 µM) and L (Mem-R8-FAM/E8, 50 µM).
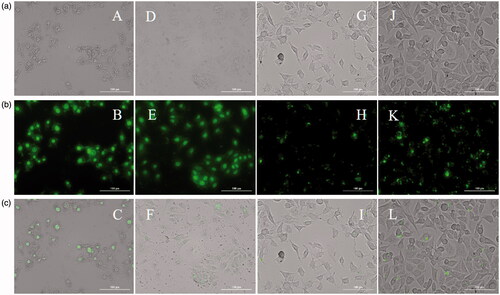
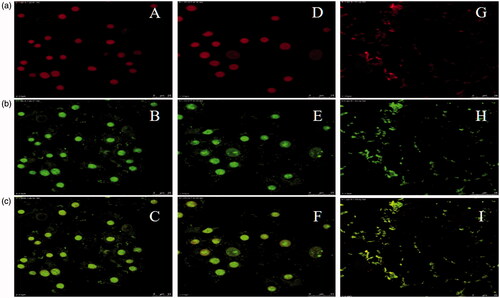
Figure 5. CLSM images. Row (a) Propidium iodide (63×): A (R8-FAM, 50 µM), D (R8-FAM, 25 µM) and G (Mem-R8-FAM/E8, 50 µM). Row (b) Fluorescent (63×): B (R8-FAM, 50 µM), E (R8-FAM, 25 µM) and H (Mem-R8-FAM/E8, 50 µM). Row (c) Merged: C (R8-FAM, 50 µM), F (R8-FAM, 25 µM) and I (Mem-R8-FAM/E8, 50 µM).