Figures & data
Figure 1. (a) UV-Vis absorption spectra at different time intervals of newly-synthesized silver nanoparticles using leaf extracts of Rhynchosia suaveolens (RS-AgNPs) and (b) FTIR spectrum of the RS-AgNPs.
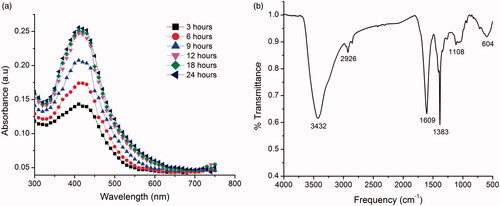
Figure 2. (a) EDX spectrum of RS-AgNPs showed higher percentage of silver signals, (b) SEM observation of synthesized RS-AgNPs and (c) TEM image of Rs-AgNPs at 50 nm.
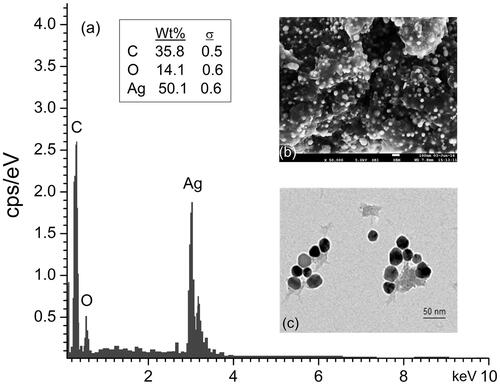
Figure 3. (a) XRD pattern of biogenic RS-AgNPs and (b) TGA thermogram of RS-AgNPs.
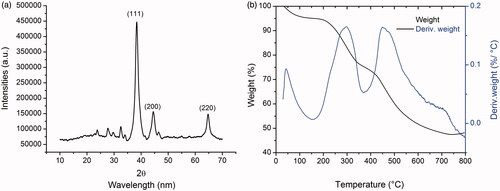
Figure 4. MTT assay results confirming the in vitro cytotoxicity effect of Rs-AgNPs against the different cancerous cell lines for 24 h. Data were expressed as mean ± SE of three independent experiments. Significant difference from positive control values, *p < .05, **p < .01 and ***p < .001. ns: non-significant.
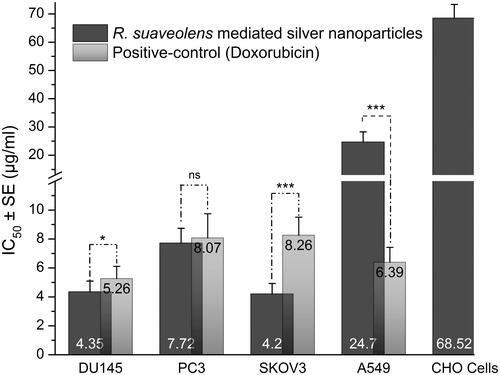
Figure 5. The effect of IC25, IC50 and IC75 concentrations of RS-AgNPs on SKOV3 cells for 24 h exposure (400×). (a) Phase contrast microscopy, (b) AO/EB staining and (c) Hoechst staining. Intact cells in control (a1, b1 and c1). Cells in the circle of AO/EB staining represents viable cells (b1), white arrows represent early apoptotic (b2, b3 and b4) and black arrow represents late apoptotic cells (b2, b3 and b4). White arrow head in Hoechst staining indicates as an early and late apoptosis (c2, c3 and c4).
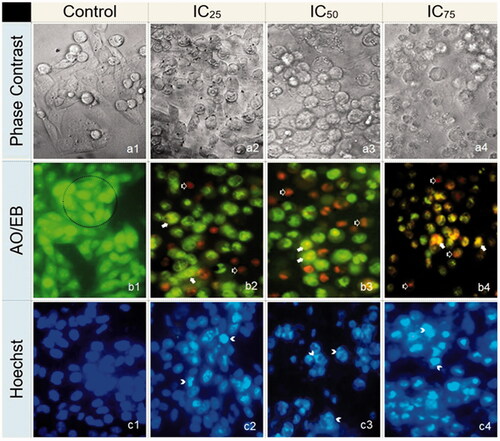
Figure 6. (a) Effect of RS-AgNPs on cellular ROS generation by spectrophotometer using H2DCF-DA as a fluorescent Probe for six and 12 h. Each value is the mean ± SE of three individual observations. Significant difference from control values, NS: non-significant. *p < .05; **p < .01 and ***p < .001 (t-test) and (b) The intracellular ROS was assessed by fluorescence microscopy and the representative images showed comparatively higher fluorescence intensity in SKOV3 cells incubated with RS-AgNPs than that of control at six and 12 h.
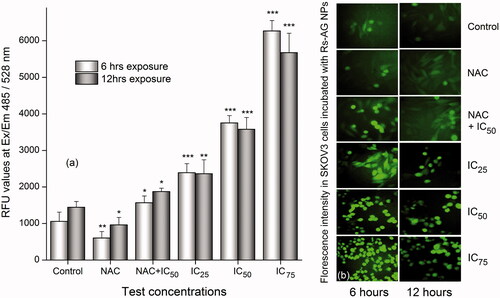
Figure 7. (a) Effect of IC25, IC50 and IC75 concentrations of RS-AgNPs on intracellular GSH and LPO levels at 24 h. Each value is the mean ± SE of three individual observations. Significant difference from control values *indicates p < .05; **p < .01 and ***p < .001 (t-test) and (b) Analysis of the DNA integrity in RS-AgNPS treated SKOV3 cells by agarose gel electrophoresis. DNA from cells was extracted and electrophoresed through a 1.8% agarose gel and visualized by staining with ethidium bromide.
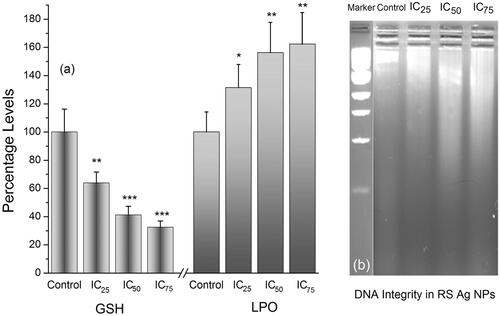
Figure 8. Fluorescence images showing an increase in expression of caspase 3/7 in SKOV3 cells treated with NAC, IC25, IC50, IC75 and NAC + IC50 concentrations of RS-AgNPs at 24 h, which showed a concentration dependent increase an expression of caspase 3/7.
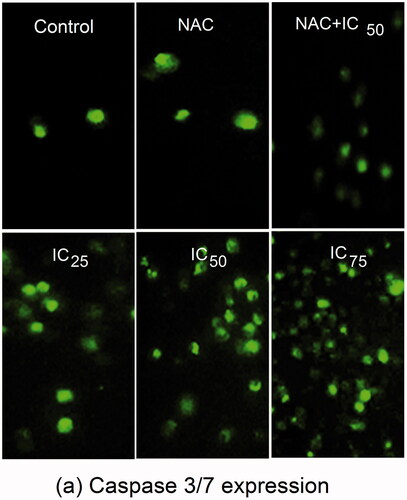
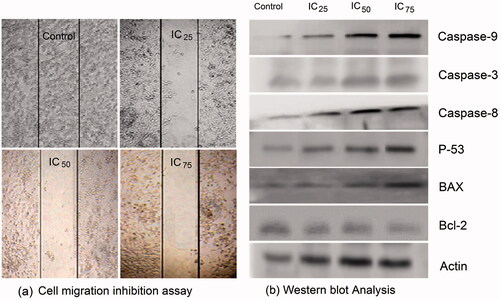
Figure 9. (a) Effect of RS-AgNPs in SKOV3 cell migration inhibition assay after 12 h. Cell migration inhibition was evident with the test concentrations that shown inhibition in a concentration dependent manner. (b) Western blot analysis of P53, Bax, Bcl-2, actin, caspases-3, -8, and -9, levels in SKOV3 cells after 24 h treatment with RS-AgNPs.