Figures & data
Figure 1. The primary hypothesis of this study. Chitosan nanoparticle loaded calcium alginate hydrogel exhibited antibacterial activity and triggered the generation of ROS, thus enhancing acute inflammatory response which was conducive to debridement and anti-infection effect. In the stage of skin tissue regeneration, it promoted proliferation and migration of VEC, and led to rapid healing.
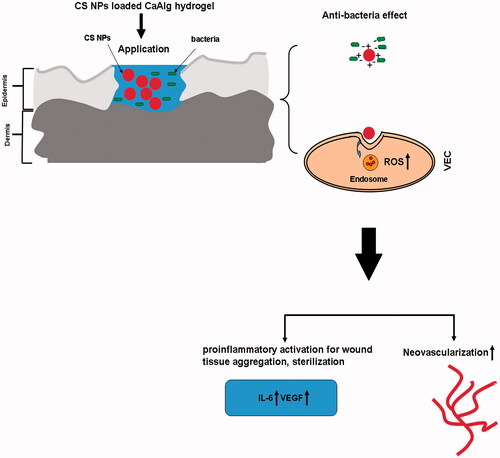
Figure 2. Schematic representation of CS NPs loaded CaAlg hydrogel preparation (A). SEM images of CS NPs loaded CaAlg hydrogel (B). FT-IR spectra of pure CS NPs, CaAlg hydrogel, simple mixture of pure CS NPs and CaAlg hydrogel, and CS NPs loaded CaAlg hydrogel (C). DLS analysis of the obtained CS NPs (D). Rheological flow curves of CS-CaAlg hydrogel and CS loaded NPs (E). In vitro swelling profile of CS NPs loaded CaAlg hydrogel and CS-CaAlg hydrogel in phosphate-buffered saline (pH 7.4 and pH 8.0 at 37 °C) for 24 h. Data are expressed as the mean ± standard deviation (n = 3) (F).
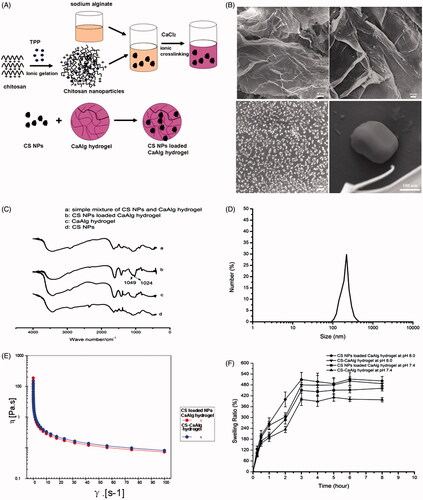
Figure 3. Photographs of culture plates of E. coli and S. aureus after exposure to CS NPs loaded CaAlg hydrogel containing different concentration of CS NPs (A). Photographs of the culture plates of E. coli and S. aureus after exposure to CaAlg hydrogel as well as CS-CaAlg hydrogel and CS NPs loaded CaAlg hydrogel with the same concentration of CS at 50 μg/mL (B). OD600 nm of bacterial suspension treated CS NPs loaded CaAlg hydrogel with different concentrations of CS NPs. These data represent three separate experiments and are presented as the mean values ± SD. *p < .05 versus OD600 nm of E. coli treated with control group, #p < .05 versus OD600 nm of S. aureus treated with control group. (C). Relative release of 260 nm absorbing materials from CS-CaAlg hydrogel and CS NPs loaded CaAlg hydrogel treated E. coli and S. aureus. These data represent three separate experiments and are presented as the mean values ± SD. *p < .05 CS-CaAlg hydrogel group versus control group, #p < .05 CS NPs loaded CaAlg hydrogel versus control group (D).
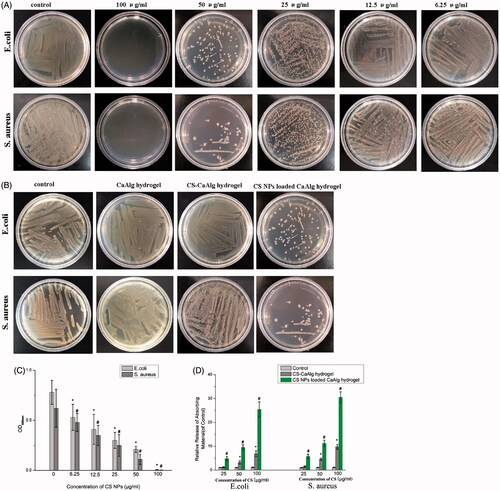
Figure 4. ROS generation in cells treated with extracts of CS NPs loaded CaAlg hydrogel and CS-CaAlg hydrogel containing low concentration of CS at 20 μg/mL and high concentration at 100 μg/mL as well as the combination of NAC and CS NPs loaded CaAlg hydrogel in HUVEC cells. *p < .05, versus ROS levels of untreated cells at 24 h, the scale bar is 100 μm and applies to all figure parts.
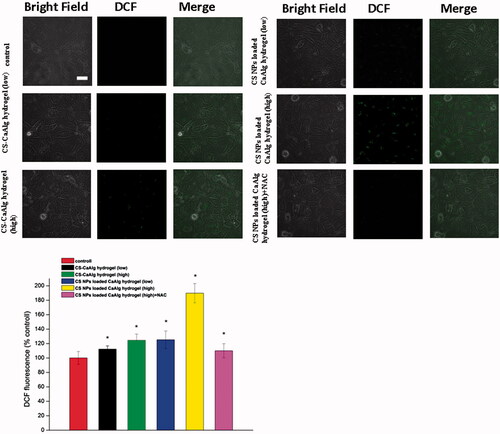
Figure 5. Tube formation in HUVECs treated with extracts of CS NPs loaded CaAlg hydrogel and CS-CaAlg hydrogel containing low concentration of CS at 20 μg/mL and high concentration at 100 μg/mL as well as the combination of NAC and CS NPs loaded CaAlg hydrogel in HUVECs (A). HUVEs viability cultured with CS NPs loaded CaAlg hydrogel (B) and CS-CaAlg hydrogel (C) containing different concentrations of CS after 24 h. Data are presented as means ± SD (n = 3).
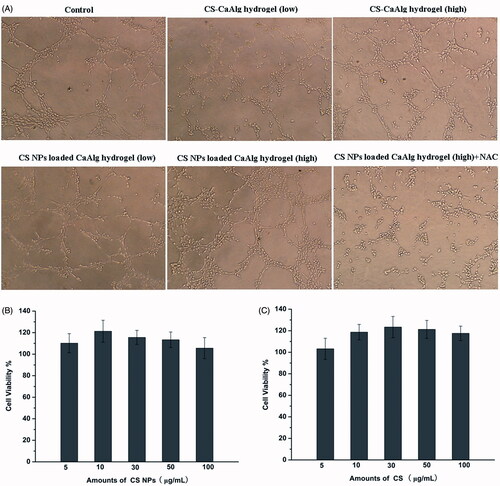
Figure 6. CS NPs loaded CaAlg hydrogel promoted migration and invasion of HUEVCs. Image (A) and quantity (C) of migration and image (B) and quantity (D) of invasion taken from HUEVC cells incubated for 24 h with extracts of CS NPs loaded CaAlg hydrogel and CS-CaAlg hydrogel containing low concentration of CS at 20 μg/mL and high concentration at 100 μg/mL as well as the combination of NAC and CS NPs loaded CaAlg hydrogel (magnification, 100×). The above assays were quantified. Results were expressed as mean ± SD (n = 3). *p < .05, versus untreated cells at 24 h.
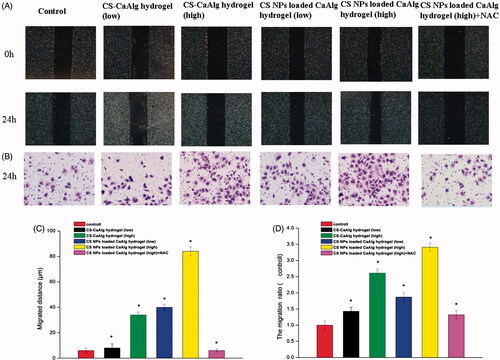
Figure 7. Expression levels of IL-6 protein in HUVEC treated with CS NPs loaded CaAlg hydrogel containing low concentration of CS at 20 μg/mL, middle concentration of CS at 50 μg/mL and high concentration at 100 μg/mL for 12 h (A). Western blot analyses of the expression levels of IL-6, VEGF, MMP-2 and Bcl-2 in HUVEC following treatment with CS NPs loaded CaAlg hydrogel for 48 h (B).
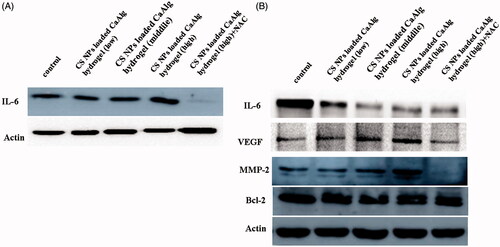
Figure 8. Photographs of the appearance of the wounds on days 7 and 14 under the treatment of CS-CaAlg hydrogel and CS NPs loaded CaAlg hydrogel (A). Wound closure curves after wound sites were treated by CS-CaAlg hydrogel and CS NPs loaded CaAlg hydrogel (B). The results were expressed as mean ± SD (n = 5).
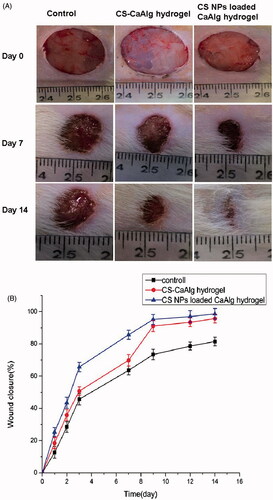
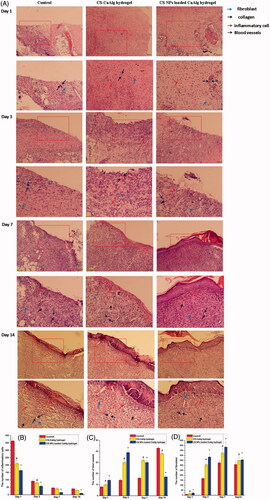
Figure 9. H&E staining of tissue sections treated with CS NPs loaded CaAlg hydrogel on days 1, 3, 7 and 14 (A). Number of inflammatory cells (B), blood vessels (C) and fibroblasts (D) on days 1, 3, 7 and 14. Data represent means ± SD (n = 3). #p < .05, CS-CaAlg hydrogel group versus the corresponding control group at the same day. *p < .05, CS NPs loaded CaAlg hydrogel group versus the corresponding control group at the same day.