Figures & data
Table 1. Patient characteristics.
Figure 1. (A) Relative expression of miR-124 in tumour tissues and normal adjacent tissues of 112 HCC patients. (B) Overall survival rate of high miR-124 expression patients and low miR-124 expression patients. Kaplan–Meier analysis was used for the statistical assessment.
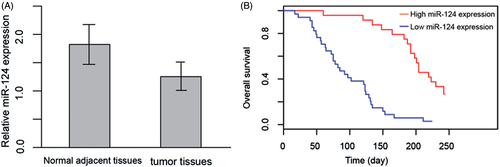
Table 2. The relationship between clinicopathological characteristics and overall survival of patients.
Figure 3. (A) Western blot and quantization of KLF4, RAB11FIP4 and RAF1 in SMMC-7221 transfected with miR-124 mimics. (B) Luciferase assay was used to confirm the targetability of KLF4 3′ UTR and miR-124. Wild type represent bona fide sequence of KLF4 3′ UTR; Mutant represents a sequence mimicking the KLF4 3′ UTR, but introduced with four single nucleotide variant.
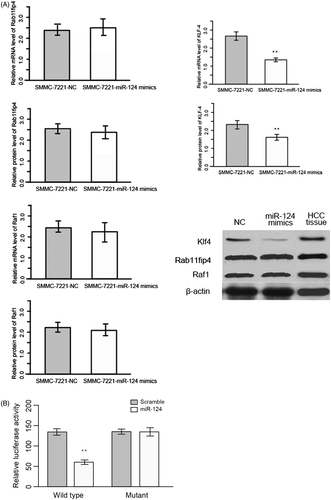
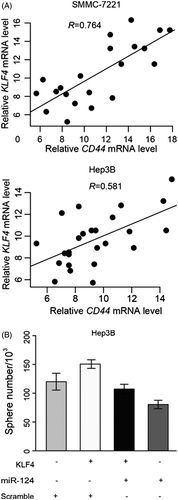
Figure 4. (A) Scatter plot of KLF4 mRNA level and CD44 mRNA level in Hep3B and SMMC-7221. The straight line indicates correlation, and R represents correlation coefficiency. (B) Sphere formation assay of Hep3B transfected with/without KLF4 and/or miR-124 (scramble sequence as control).