Figures & data
Figure 1. SEM micrographs of PLGA microparticles, prepared using the solvent diffusion/evaporation method, at different magnification (a, b). Panel c of the cut microparticle shows the inner particle porosity. Microanalysis spectra of the upper surface (d) and of the cross section (e) of the scaffold coated with chitosan/chondroitin-4-sulphate. The inserts show SEM micrographs of the scaffold upper surface (d) and cross section (e).
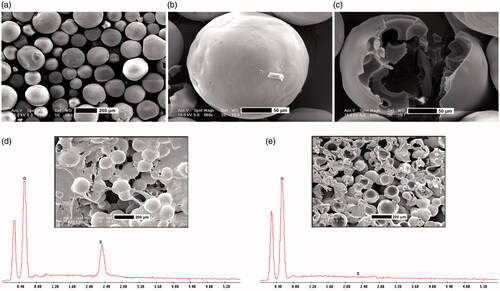
Figure 2. Comparison of the residual mass between uncoated and coated scaffolds over the 28 days of the degradation period (a). Polymer Mw (b), Mn (b) and PDI (c) profile of uncoated scaffolds during degradation. Photos of coated scaffolds at 1 h (T0), and 1 (T1), 7 (T7), 14 (T14) and 21 (T21) days of degradation in PBS (0.1 M, pH 7.4) at 37 °C (d). SEM micrographs of the upper surface of the coated scaffold at different degradation times (e).
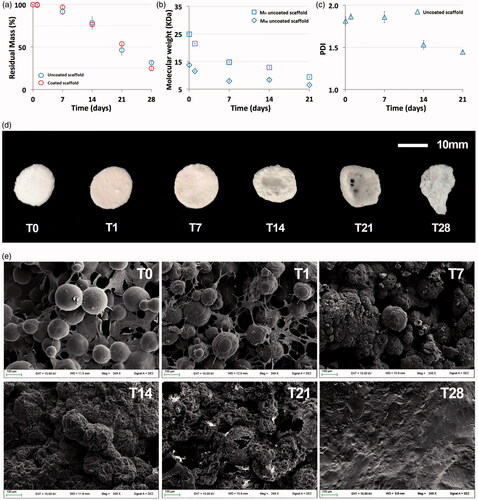
Figure 3. Coated scaffold rendering of computed tomographic (CT) images (a). Compressive stress of uncoated (b) and coated (c) scaffolds and the Young’s modulus at 50% (d) and 75% (e) of strain for the scaffolds after 1 h (T0) and 1 (T1), 7 (T7), 14 (T14) and 21 (T21) days of incubation in PBS (0.1 M, pH 7.4) at 37 °C. Data are expressed as mean ± SD, *p < .05 by student t-test.
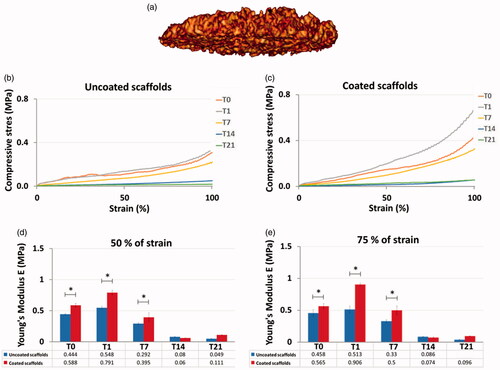
Figure 4. CAM assay of the coated scaffold (a). Histology of the scaffold deposed on the CAM at 100× magnification (b) and 400× magnification (c). Scaffold sections were stained with hematoxylin and eosin.
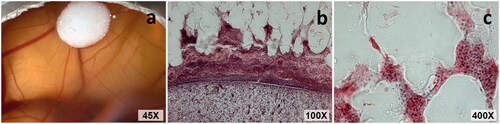
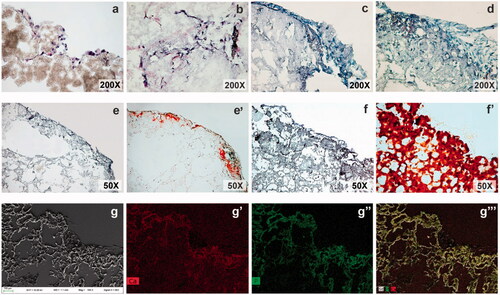
Figure 5. Cross section (16 µm) of the coated scaffolds at 7 (a), 23 (b), 35 (c) and 60 (d) days of culture in a commercial osteogenic differentiation medium (Lonza™). Sections were stained with HE staining methods. Comparison between scaffold sections stained with HE and AR at 35 (e, e′) and 60 (f, f′) days of culture in the induction medium. Calcium deposits are stained in red (e′, f′). SEM micrograph (g) and microanalysis of a section of the scaffold at 60 days of culture in induction medium. Ca mapping (g′), P mapping (g″) and overlapping image (g‴).