
Figures & data
Figure 1. Mannopyranosylation of CS.
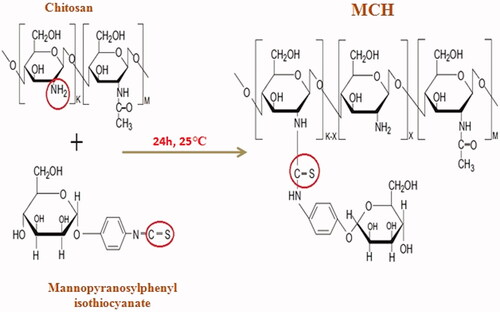
Figure 2. FTIR spectrums of CS (A) and MCH (B).
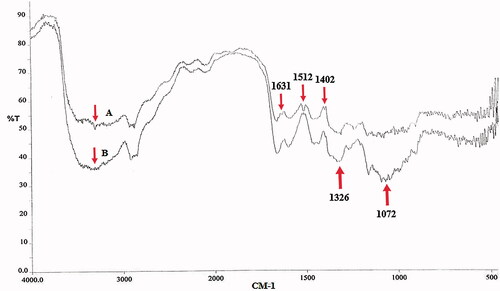
Figure 3. TGA analyses of CS (A) and MCH (B).
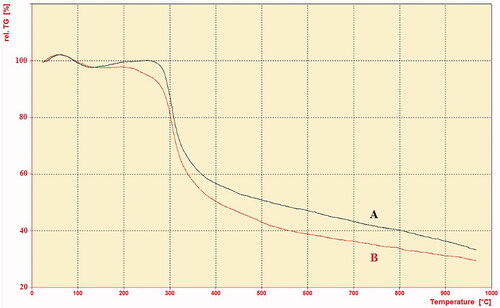
Figure 4. DTA analyses of CS (A) and MCH (B).
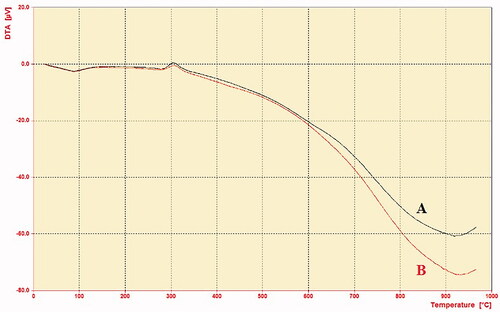
Figure 5. Elemental analysis of CS (A) and MCH (B).
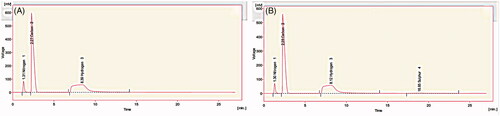
Figure 6. SEM images of free CS NPs (A), Loaded CS NPs (B), unloaded MCH NPs (C), and Loaded MCH NPs (D).
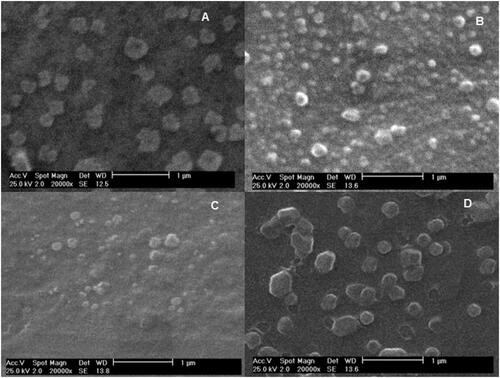
Table 1. The characterization of CS and MCH NPs.
Table 2. Release parameters of rHBsAg sustained release from NPs.
Figure 7. MTT assay against HEK293 cells with different concentrations of rHBsAg loaded CS and MCH NPs. *p < .02, **p < .01, and ***p < .001 compared to the untreated group as a control. The results are reported as mean ± SD, n = 3. p values of < .05 were considered significant.
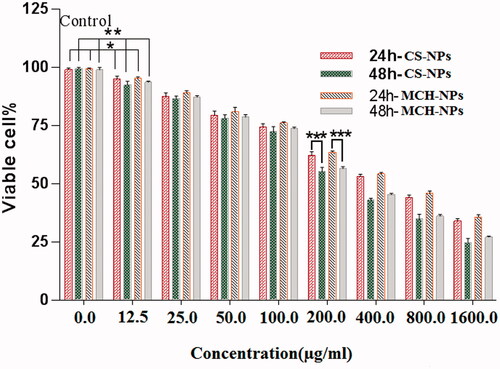
Figure 8. Body weight changes after intraperitoneally administration of CS loaded NPs (mice (A) and guinea pigs (B)) and MCH loaded NPs (mice (C) and guinea pigs (D).
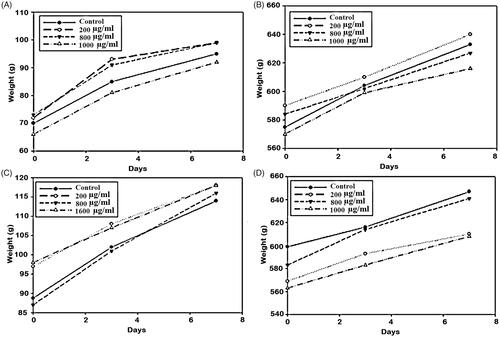
Figure 9. CombiStats analysis of commercial vaccine (standard), CS nanoparticle (sample 1), and MCH NPs (sample 2) IgG titer results after intraperitoneally injection in mice.
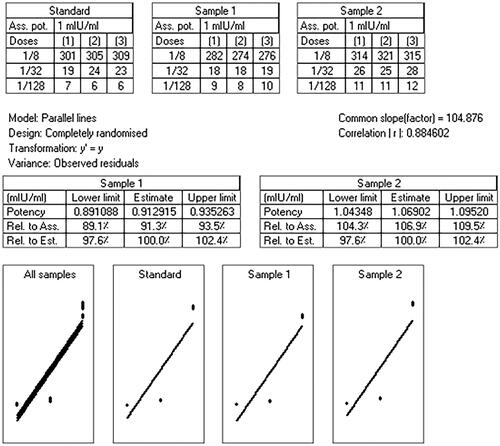
Figure 10. Immunological studies: serum anti-HBsAg profile of mice immunized with different formulations containing HBsAg. *p < .01, **p < .001, and ***p < .0001.
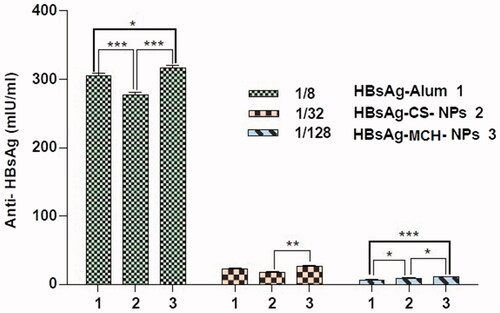
Figure 11. SEM images of rHBsAg loaded MCH NPs incubation (A) two months, (B) four months, and (C) six months in stability condition.
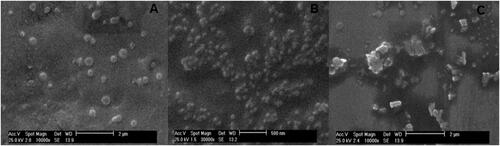
Table 3. Characterization of MCH NPs during stability test.