
Figures & data
Scheme 1. (a) Preparation of cysteamine-folic acid conjugate. DCC: dicyclohexylcarbodiimide;NHS: N-hydroxysuccinimide; DMSO: dimethyl sulfoxide; TEA trimethylamine. (b) Surface modification of Fe2O3@Au core-shell nanoparticles with cysteamine-folic acid conjugate.
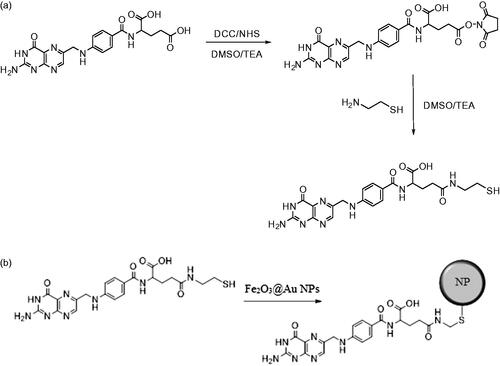
Figure 1. TEM images(a,b) and DLS of the synthesized core-shell nanoparticles (with and without FA; (c,d)).
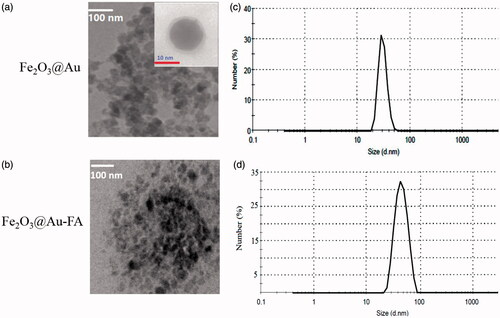
Figure 2. Surface charge distribution of (a) Fe2O3@Au and (b) Fe2O3@Au-FA nanocomplex by zeta potential measurement.
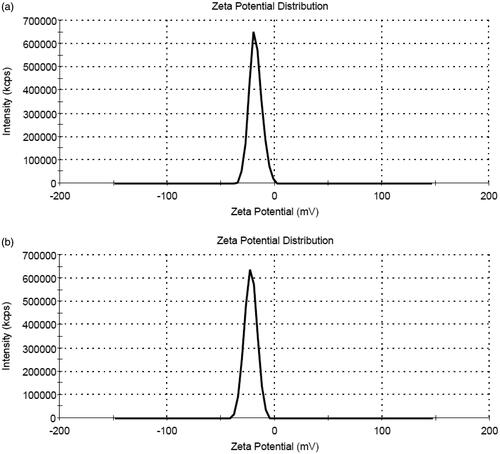
Figure 3. (a) UV-Vis spectra show a red-shift in the surface plasmon resonance of Fe2O3@Au core-shellNPs due to attachment to the FA-cysteamine. (b) UV-Vis spectra of FA conjugated Fe2O3@Au core shell NPs and Fe2O3 NPs in water. Arrow shows the wavelength of the laser utilized for PTT. (c) Change in the color of colloidal Fe2O3@Au core-shell NPs from garnet (left) to grayish brown (right) after formation of the FA conjugated Fe2O3@Au complex.
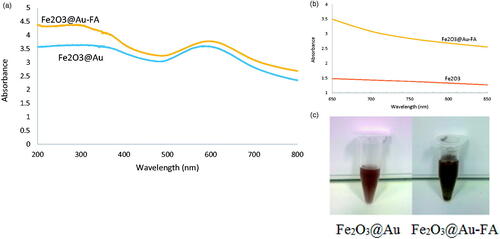
Figure 4. Fourier transform infrared (FTIR) spectra of (a) Fe2O3@Au-cysteamine-FA nanoconjugate and (b) FA.
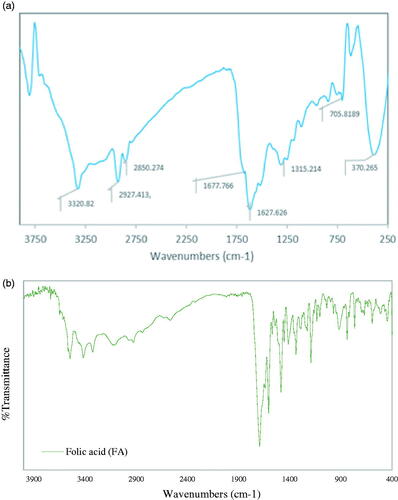
Figure 5. Magnetization curve of Fe2O3@Au nanocomplex and Fe2O3@Au-FA nanoconjugate.
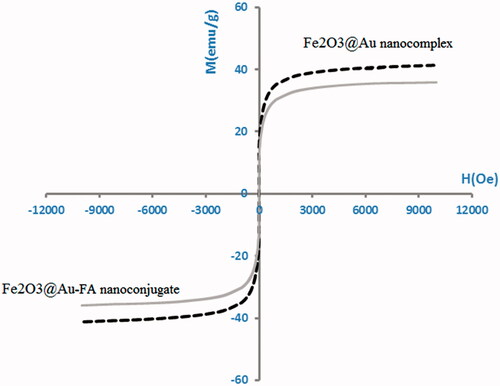
Figure 6. Temperature rise profile of the KB cancer cells incubated with Fe2O3@Au NPs at different Au concentrations upon administration of NIR laser (808 nm; 6 W/cm2; 10 min).
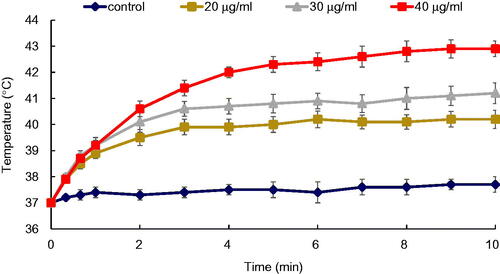
Figure 7. Temperature rise profile of the KB cancer cells incubated with FA conjugated Fe2O3@Au NPs at different Au concentrations upon administration of NIR laser (808 nm; 6 W/cm2; 10 min).
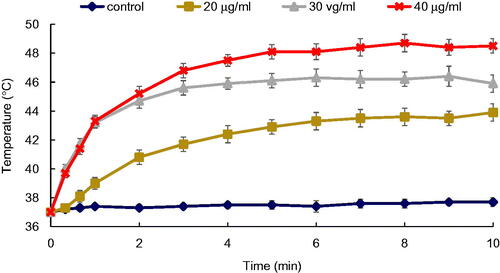
Figure 8. Final temperature rise of the KB cancer cells incubated with Fe2O3@Au (black) and Fe2O3@Au-FA NPs (red) at different Au concentration following 10 min NIR laser irradiation (808 nm; 6 W/cm2).
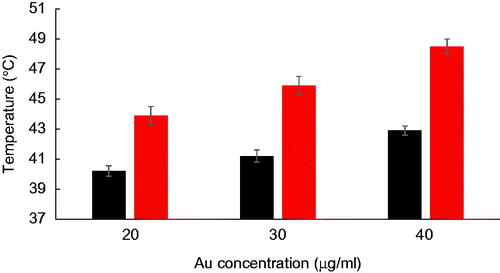
Figure 9. Thermal doses applied to the KB cancer cells for NIR laser irradiation (808 nm; 6 W/cm2; 10 min) alone (concentration =0) and for combination of laser and Fe2O3@Au (black) and Fe2O3@Au-FA NPs (red) at different Au concentrations.
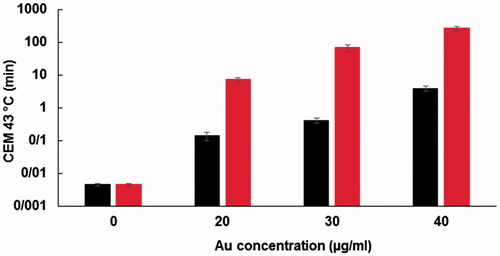
Figure 10. (a) The viability of KB cells incubated with different concentrations of nanoconjugates for 4 h. High level of cytotoxicity is observed for the concentrations greater than 20 μg/ml. (b) The viability of KB cells incubated with Fe2O3@Au (NPs) and Fe2O3@Au-FA (FA-NPs) for 4 h (concentration: 20 μg/ml).
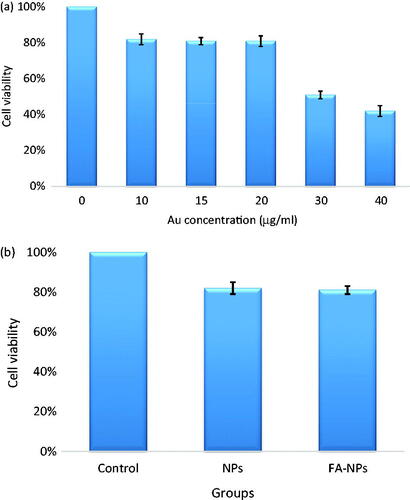
Figure 11. (a) Flow cytometric analysis to determine death modes of KB cells after receiving various treatments. (b) The percentage of necrotic and apoptotic KB cells after receiving various treatments.
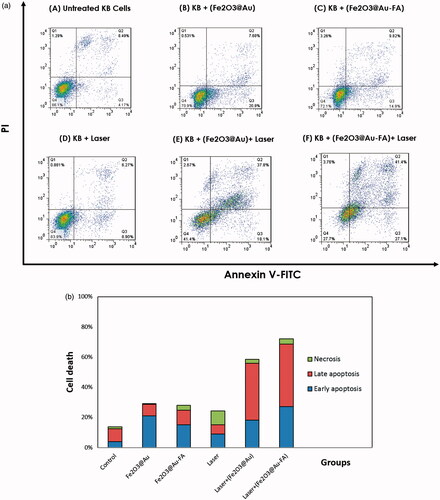
Table 1. The temperature elevation rates of the KB cancer cells incubated with different concentrations of Fe2O3@Au NPs and Fe2O3@Au-FA NPs following NIR laser irradiation (808 nm; W/cm2; 10 min).
Table 2. The “X-fold” increases in temperature elevation rates of the KB cancer cells during laser irradiation in the presence of Fe2O3@Au NPs and Fe2O3@Au-FA NPs at different Au concentrations.
Table 3. The “X-fold” increase in peak temperature of the KB cancer cells incubated with Fe2O3@Au NPs and Fe2O3@Au-FA NPs at different Au concentrations with respect to 0% au concentration at the end of 10 min NIR laser irradiation.