Figures & data
Figure 1. Analysis of FA and ASP using HPGPC method.
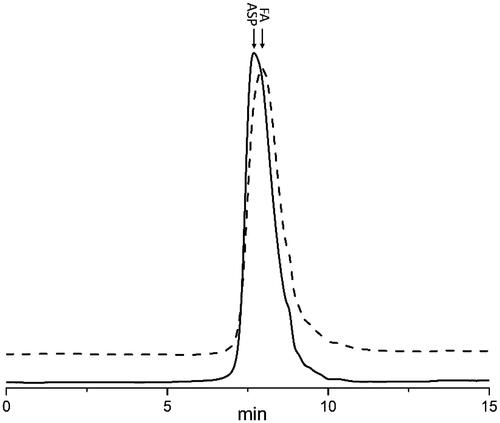
Figure 2. Representative chromatograms for the determination of FA in plasma (A) and various tissues (B: liver; C: stomach; D: spleen; E: heart; F: intestines) by HPGPC. (1) Blank plasma or tissue; (2) Blank plasma or tissue spiked with standard FA solution; (3) Plasma or tissue samples collected after intravenous injection of FA; (4) FA dissolved in phosphate buffer (pH =7.4).
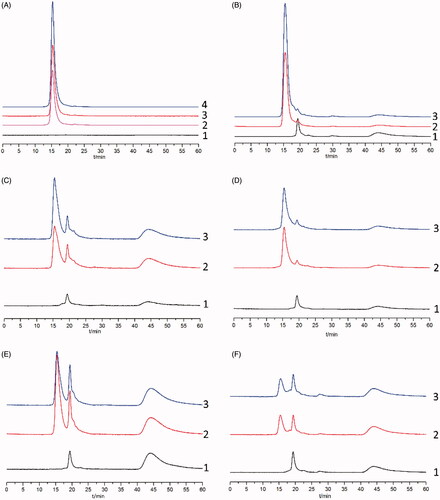
Table 1. Calibration curves for FA in rat plasma and tissues (n = 5).
Table 2. Distribution of FA in tissues (n = 5)..
Figure 3. ASP concentration versus time profile following intravenous administration. Data are presented as mean ± SD (n = 6).
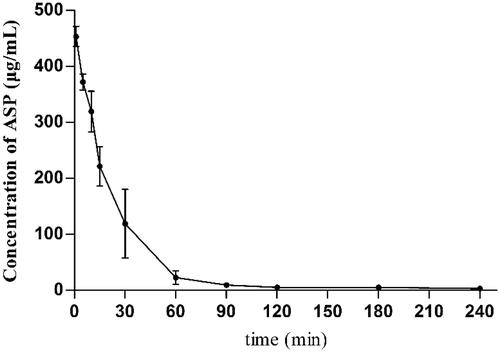
Figure 4. Hepatocytes uptake of FA. (A) Distributions of FA and FD in liver parenchymal and non-parenchymal cells 2 h after intravenous injection at a dose of 6 mg/kg. Values are given as mean ± SD (n = 3). (B) Fluorescence microscopic examination of paraffin sections of mice liver 2 h after intravenous injection of FA (B1) and FP (B2). The bar represents a length of 50 μm. (C) Fluorescence intensity of FA in liver parenchymal cells. (D) The uptake rate of FA in liver parenchymal cells. Values are given as mean ± SD (n = 3).
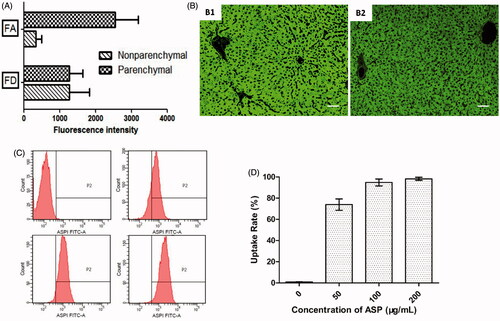
Figure 5. (A) Uptake rate of cells treated with different concentrations of FA (n = 3). ▪, HepG2 cells, •, Bel-7402 cells, ▲, Hela cells; (B) Effect of NGA on the uptake of FA to cells (n = 3); (C) Effect of NGA or dextran on the uptake of FA to mice liver (n = 3).
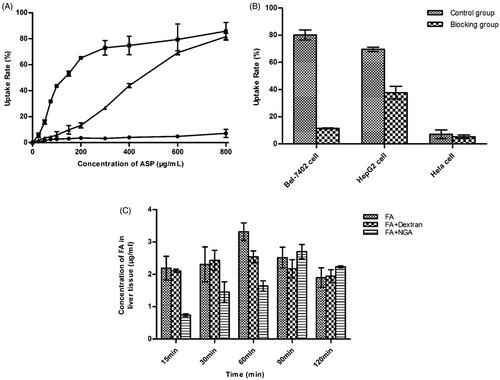
Figure 6. Preparation of 99mTc-DTPA-ASP. (A) The reaction route. (B) IR spectra of ASP and DTPA-ASP. (C) 1H-NMR spectra of ASP, DTPA and ASP-DTPA. (D) Chromatographic separation of 99mTc-DTPA-ASP and Na99mTcO4 using physiological as mobile phase.
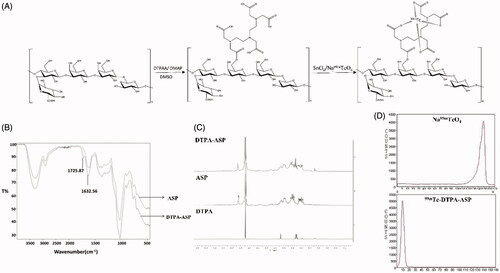
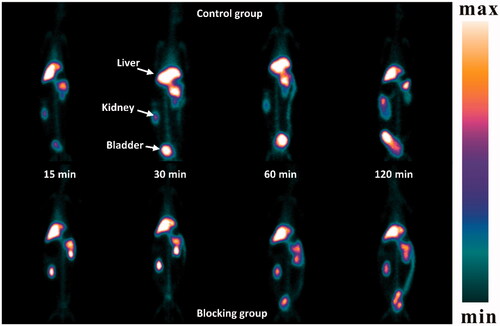
Figure 7. Planar images of rabbit after ear intravenous injection of 99mTc-DTPA-ASP with or without NGA. The upper row is control group; low row is blocking group.