Figures & data
Table 1. Determination of drug and polymers.
Figure 1. In vitro drug release of CS/PLA-PIC NPs formulations for 6 days.
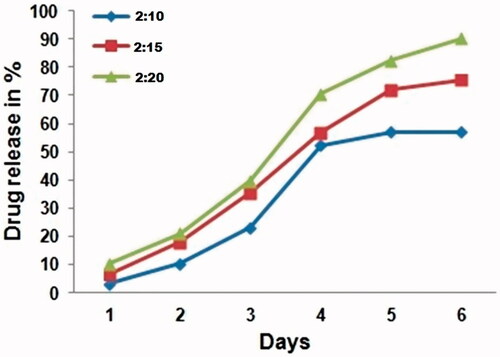
Figure 2. Antioxidants activity of CS-PLA NPs, PIC and CS/PLA-PIC NPs with the control of quercitin. (a) DPPH (b) SOD and (c) NO scavenging activities.
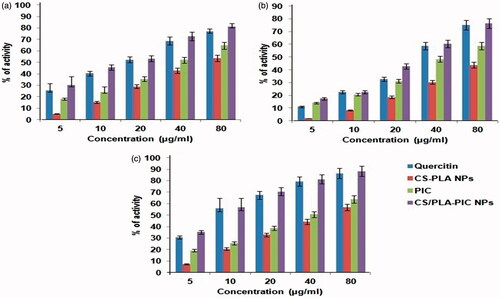
Figure 3. (A) MTT assay of CS-PLA NPs, PIC and CS/PLA-PIC NPs with (a) HepG2. (b) A549 (c) MCF7 cell lines. (B) LDH activity of CS-PLA NPs, PIC and CS/PLA-PIC NPs with (a) HepG2. (b) A549 (c) MCF7 cell lines.
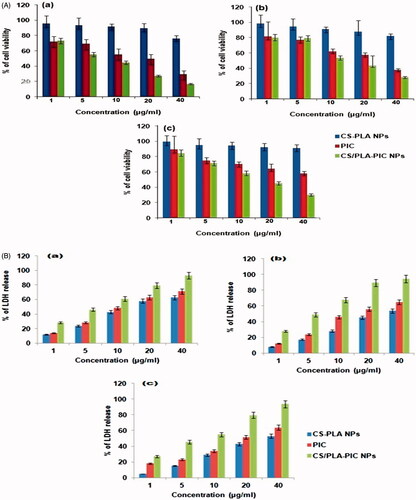
Figure 4. Analysis of DNA isolated from HepG2, A549 and MCF cells incubated with IC30 and IC50 concentration of CS/PLA-PIC NPs for 24 h; cells without treatment (lane C), HepG2 cells treated with 20 µg/ml (lane 1), and 40 µg/ml (lane2), A549 cells treated with 40 µg/ml (lane 1), and 60 µg/ml (lane 2) and MCF7 cells treated with 40 µg/ml(lane 1), and 60 µg/ml(lane 2).
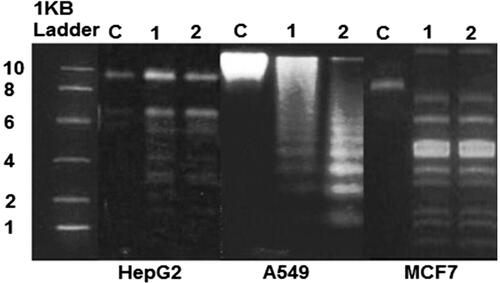
Figure 5. Cells stained with AO and EB of CS/PLA-PIC treated HepG2, A549, and MCF cells at 24 h. Cells without treatment (control) HepG2 cells treated with (a) 20 µg/ml, (b) 40 µg/ml and (c) 60 µg/ml. A549 cells treated with (a) 40 µg/ml, (b) 60 µg/ml and (c) 80 µg/ml. MCF7 cells treated with (a) 40 µg/ml, (b) 60 µg/ml and (c) 80 µg/ml.
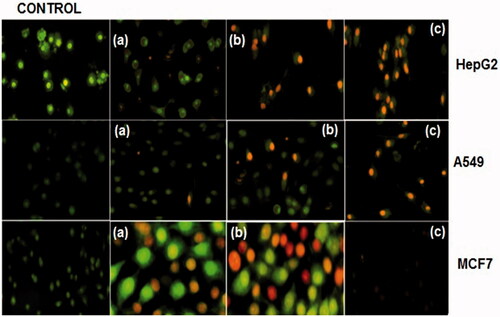
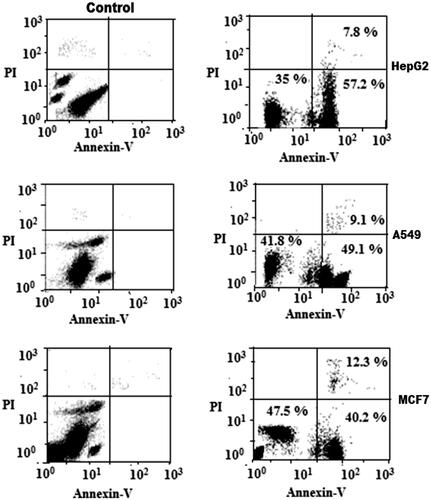
Figure 6. Flow Cytometric analysis of the cancer cell lines treated with CS/PLA-PIC NPs (right) compared with control (left).