Figures & data
Figure 1. Physical characterization of the EGCG-loaded NLC-RGD. Size and polydispersity index (PDI) of nanoparticles, (a) after preparation, (b) after 2 months of storage at 4–8 °C, (c) scanning electron microscopy (SEM) image of NPs, (d) Zeta potential distribution of nanoparticles.
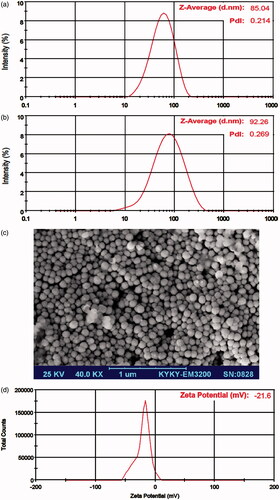
Figure 2. Cytotoxic effects of EGCG, EGCG-loaded NLC, EGCG-loaded NLC-RGD (a), DOX (b) and synergistic effects of combinatorial treatment of 1 µM DOX and 10 µM of EGCG and EGCG-loaded NPs for 48 h on MDA-MB-231 cells (c). The figure illustrates that EGCG-loaded NLC-RGD are more anti-proliferative when compared with EGCG-loaded NLC (p > .05). Data are presented as mean ± standard deviation (n = 3).
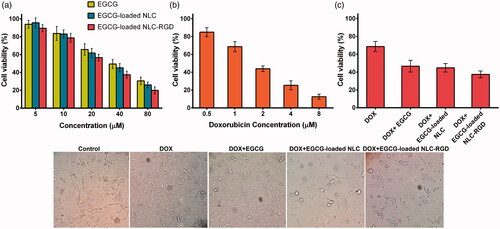
Figure 3. Haemolysis assay of RBSs exposed to different concentration of NLC-RGD. (a) There is no considerable (less than 5%) haemolytic activity for EGCG-loaded NLC-RGD up to 45 µg/ml. Error bars represent the standard deviation of three measurements (n = 3). (b) Photographs of each treated sample as well as positive and negative controls. (c) Microscopic images of red blood cells treated by NLC-RGD.
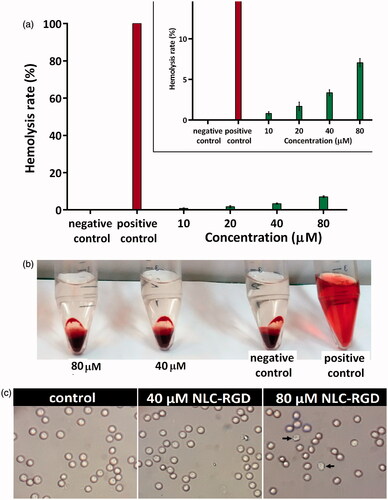
Figure 4. Cell uptake study of EGCG-loaded NLC versus EGCG-loaded NLC-RGD into MDA-MB-231 cells (a). Fluorescence microscope images of treated MDA-MB-231 cells with Rhodamine B-loaded NLC (b) and NLC-RGD (c).
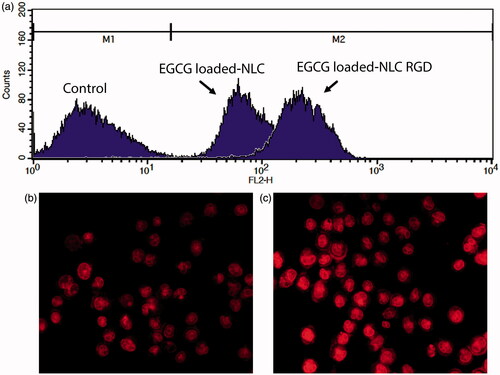
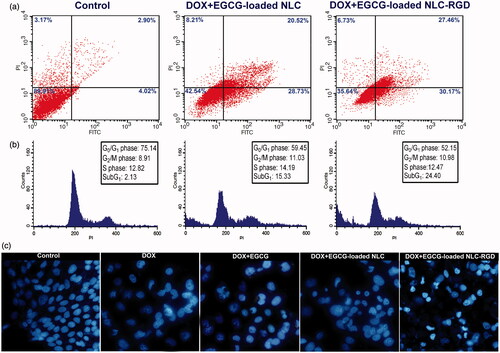
Figure 5. (a) The percentage of apoptosis and necrosis in MDA-MB-231 cells induced by combinatorial treatment of DOX and EGCG-loaded NPs. (b) Effects of combinatorial treatment of DOX and EGCG-loaded NPs on cell-cycle distribution of MDA-MB-231 cells. (c) Fluorescent images of DAPI stained cancerous cells following a 48 h exposure by DOX and EGCG-loaded NPs.