Figures & data
Table 1. The primer sequences of Cav3.1 and β-actin for qRT-PCR.
Figure 1. The morphological changes of SH-SY5Y cells treated with different concentrations and exposure time of lidocaine hydrochloride. Attached cells grown in multiwall culture plates were observed at room temperature. Images were taken using an inverted microscope. All images have the same magnification of ×100, bar = 25um.
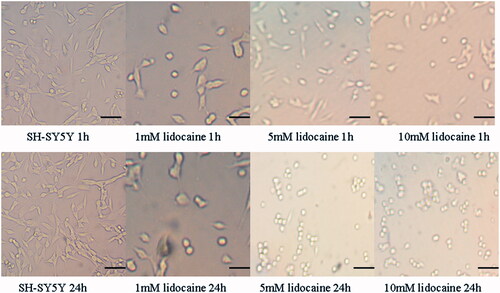
Figure 2. Cell viability of the SH-SY5Y cells treated with 1, 5 and 10 mM lidocaine hydrochloride (mean ± sd, n = 6). Comparison among the groups, ap < .05 versus 0 h, bp < .05 versus 1 h, cp < .05 versus 12 h; Comparison in intergroups, dp < .05 versus 1 h of the L1 group, ep < .05 verssu 1 h of the L5 group, fp < .05 versus 12 h of the L1 group, gp < .05 versus 12 h of the L5 group, hp < .05 versus 24 h of the L1 group, Ip < .05 versus 24 h of the group L10.
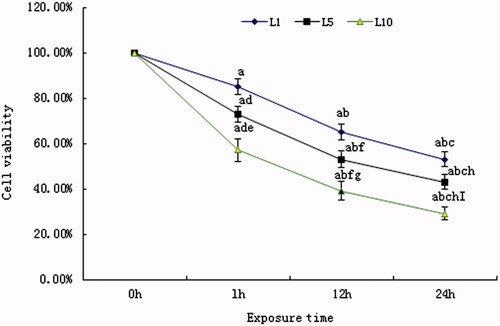
Figure 3. The cell death rate detected with Hoechst33342/PI. (A) The death cells untreated or treated with lidocaine hydrochloride (Hoechst33342/PI, 20×, bar = 50 µm). PI indicated the death cells, Hoechst33342 staining indicated the nucleus and the merged image was the combination of those two pictures (normal cells: untreated with lidocaine hydrochloride; L1: cells treated with 1 mM lidocaine hydrochloride for 24 h; L5: cells treated with 5 mM lidocaine hydrochloride for 24 h; L10: cells treated with 10 mM lidocaine hydrochloride for 24 h). (B) The death cells rate analysis (mean ± sd, n = 6), ap < .05 versus normal cells, bp < .05 versus cells in L1 group L1; cp < .05 versus cells in group L5.
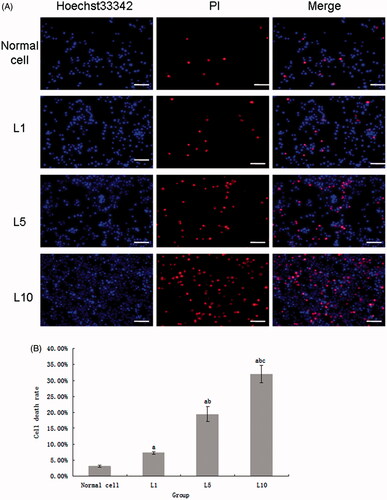
Figure 4. (A) The Cav3.1 expression of the cultured cells untreated or treated with lidocaine hydrochloride (Cy3-DAPI, 200×, bar = 20μm). Cy3 indicated the Cav3.1 protein expression, DAPI staining indicated the nucleus, and the merged image was the combination of those two pictures (normal cells: untreated with lidocaine hydrochloride; L1: cells treated with 1 mM lidocaine hydrochloride for 24 h; L5: cells treated with 5 mM lidocaine hydrochloride for 24 h; L10: cells treated with 10 mM lidocaine hydrochloride for 24 h). (B) The Cav3.1 positive cells analysis (mean ± sd, n = 6), ap < .05 versus normal cells, bp < .05 versus cells in the L1 group L1; cp < .05 versus cells in L5 group.
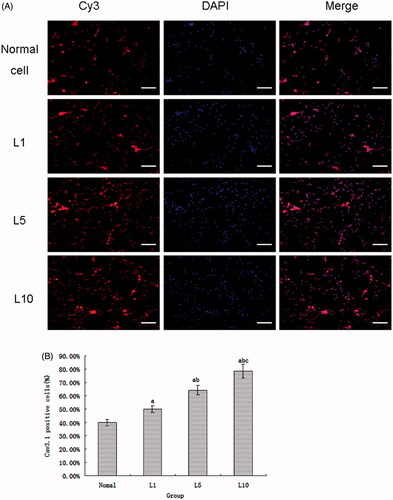
Figure 5. Cav3.1 protein expression of the SH-SY5Y cells treated with 1, 5 and 10 mM lidocaine hydrochloride (mean ± sd, n = 6). (A) Represents band of the Cav3.1 protein and β-actin. (B) Comparison among the groups, ap < .05 versus 0 h, bp < .05 versus 1 h, cp < .05 versus 12 h; comparison in intergroups, dp < .05 versus 1 h of the L1 group, ep < .05 versus 1 h of the L5 group, fp < .05 versus 12 h of the L1 group, gp < .05 versus 12 h of the L5 group.
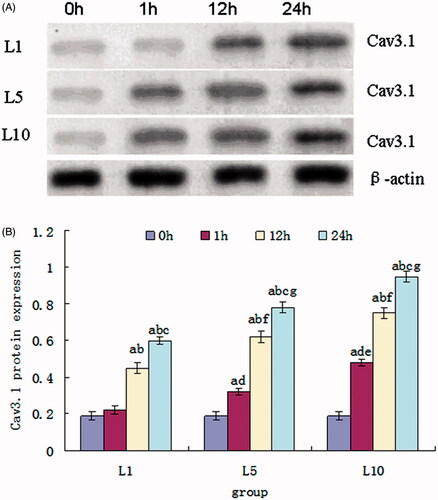
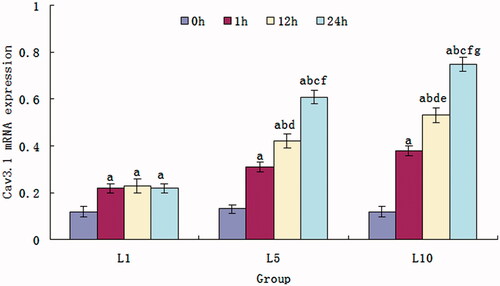
Figure 6. Cav3.1 mRNA expression of the SH-SY5Y cells treated with 1, 5 and 10 mM lidocaine hydrochloride (mean ± sd, n = 6). Comparison among the groups, ap < .05 versus 0 h, bp < .05 versus 1 h, cp < .05 versus 12 h; Comparison in intergroups, dp < .05 versus 1 h of the L1 group, ep < .05 versus 1 h of the L5 group, fp < .05 versus 12 h of the L1 group, gp < .05 versus 12 h of the L5 group.