Figures & data
Figure 1. Fabrication of iron oxide nanoparticle-containing CPC (IONP-CPC). (a) TEM image of γIONPs. (b) TEM of αIONPs. (c) Magnetic hysteresis loops of γIONPs and αIONPs, showing that γIONPs were super-paramagnetic, while αIONPs were not. (d) The overlap magnetic hysteresis loop of VSM results confirmed that γIONP-CPC was super-paramagnetic, while CPC control and αIONP-CPC were not super-paramagnetic. (e) CPC control, γIONP-CPC and αIONP-CPC. Only γIONP-CPC was attracted by a magnet.
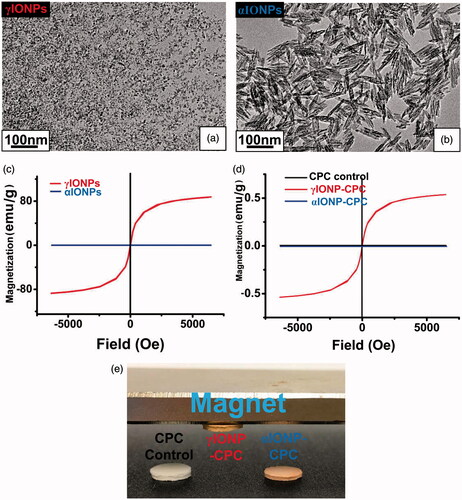
Figure 2. IONP-CPC promoted the adhesion, spreading and proliferation of hDPSCs. (a) Images of live cells stained with Calcein AM (green) at different time points after seeding: 4 h and 14 days. (b) Cell spreading area on the scaffold. (c) Cell adhesion ratio normalized by culture well control. (d) Cell proliferation on the scaffold by CCK-8 (n = 4). Cells on γIONP-CPC were significantly more than CPC control. Cell spreading on γIONP-CPC was significantly greater than that on CPC control. In each plot, bars indicated by different letters are significantly different from each other (p < .05).
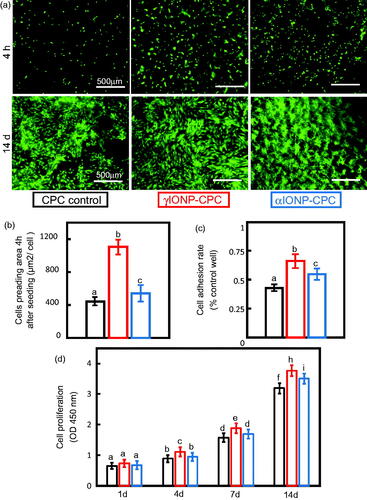
Figure 3. ALP activity of hDPSCs cultured on CPC control, γIONP-CPC and αIONP-CPC at 4, 7 and 14 days (n = 6). ALP activity of hDPSCs on γIONP-CPC was significantly higher than that on CPC control at 7 and 14 days. In each plot, bars indicated by different letters are significantly different from each other (p < .05).
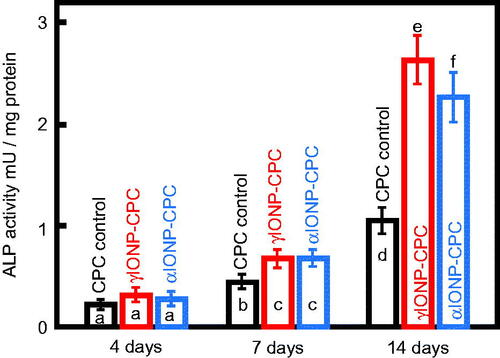
Figure 4. The mRNA expression levels of osteogenic genes in hDPSCs at 7 days and 14 days, with all data relative to hDPSCs on CPC control. (a) Expression levels of ALP. (b) Expression levels of COLIα. (c) Expression levels of RUNX2. (d) Expression levels of OCN (n = 3). In each plot, bars with different letters are significantly different (p < .05).
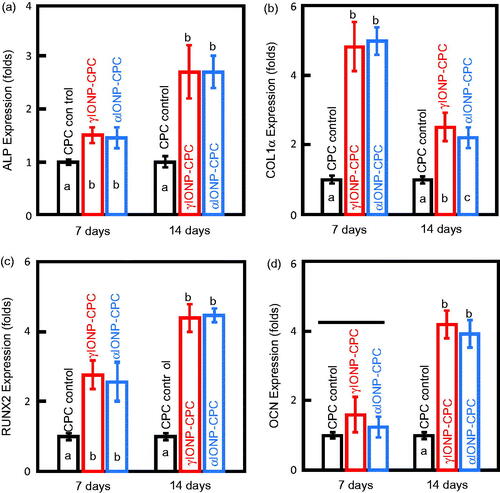
Figure 5. Bone matrix mineral synthesis by hDPSCs on the scaffolds (n = 3). Bars indicated by different letters are significantly different from each other (p < .05).
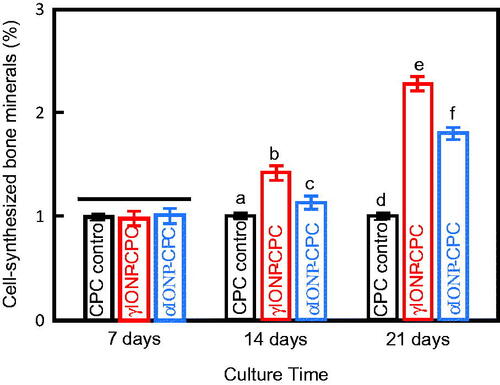
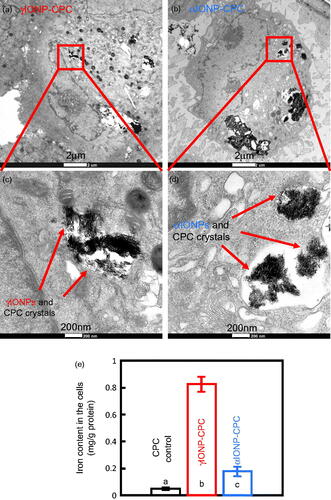
Figure 6. High-magnification TEM images inside the cells, showing hDPSCs with endocytic IONPs. (a) Cells seeded on γIONP-CPC contained internalized nanoaggregates inside the cells. (b) Cells seeded on αIONP-CPC had internalized nanoaggregates inside the cell. (c) Quantitative measurement of iron content by ICP-OES. Data = mean ± SD (n = 4). Bars indicated by different letters are significantly different from each other (p < .05).