Figures & data
Figure 1. Morphology and diameter of fibers in three types of scaffolds. SEM images of PCL nanofiber without (a), with Chitosan nanoparticles (b) and Chitosan nanoparticles loading with PDGF-BB (c). Incorporation of Chitosan NPs increased the mean diameter and diameter distribution of fibers in groups PCL/NP (e) and PCL/NP/PDGF-BB (f) compared to the group PCL (d). Fiber diameter percentage at different ranges is shown for PCL (g), PCL/NP (h) and PCL/NP/PDGF-BB (i) using images a, b and c in conjunction with ImageJ. SEM photograph of chitosan nanoparticles (j), TEM images of PCL nanofiber containing chitosan nanoparticles (k) and in vitro release profile of PDGF-BB encapsulated in chitosan nanoparticles incubated in dH2O at room temperature on a rotary shaker at 70 rpm (l).
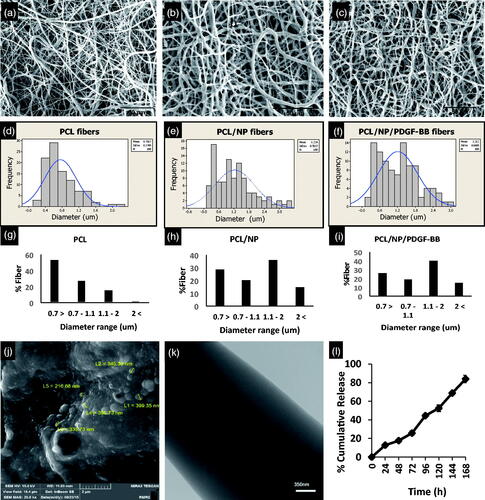
Table 2. Different mechanical parameters such as ultimate tensile strength, strain at break and elastic modulus of PCL, PCL/NP and PCL/NP(PDGF).
Table 1. Primers used in real-time RT-PCR.
Figure 2. Growth morphology of cells on three types of scaffold. Cells prefer to growth in the form of several dens populations of cells on PCL/NP nanofibers (c,d) and PCL/NP/PDGF-BB nanofibers (e,f) compared to cells growth on PCL nanofibers (a,b) which distributed uniform with random orientation on the substrate. Cell masses on PCL/NP/PDGF-BB (e,f) are aligned and well oriented compared to cell masses on PCL/NP (c,d). The mean aspect ratio of cell masses in two types of scaffolds containing chitosan nanoparticles (g). Morphology of cells when they are seeded with low density on three types of scaffolds. Single cells on PCL/NP (j,k) and PCL/NP/PDGF-BB (l,m) nanofibers cannot protrude and spread well enough compared to single cells on the PCL nanofibers (h,i). They are also well oriented on PDGF-BB-containing nanofibers (m) compared to single cells on PCL/NP (k) and PCL (i) nanofibers. Quantitative measurements of cell proliferation in four different serum starved conditions (n). Arp 2 and PDGFRβ gene expression at mRNA level of cells seeding on PCL/NP/PDGF-BB and PCL/NP compared to TCPS as control (o). Cells were seeded with same confluences in different positions of the central well (p).
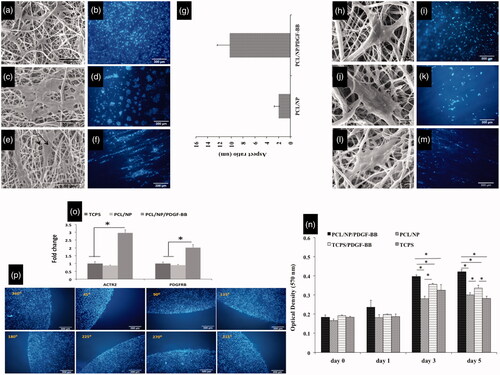
Figure 3. Migration of cells from the border of central well toward under gel. Cells can diffuse from part A to part B. The border of the well is shown with black arrows (a). Schematic picture of cell distribution at day 6 when a chemo-attractant, particularly a punch of bioactive scaffold, was put inside one of the lateral wells (b). The cell mass grows till near the scaffold punch containing PDGF-BB at position 360° (c).
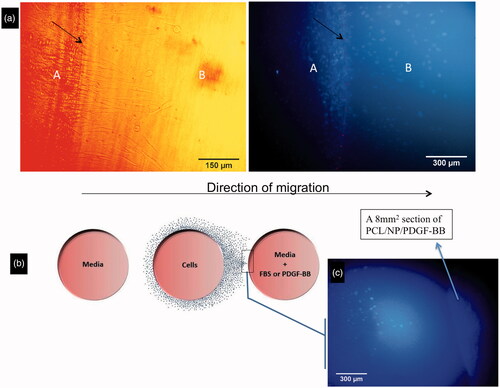
Figure 4. The average of 10 cells’ distances which were vertically farthest from the border of central well at 8 different positions, day 3 (a) and day 6 (b). Total number of migrating cells in different groups at days 3 and 6 (c).
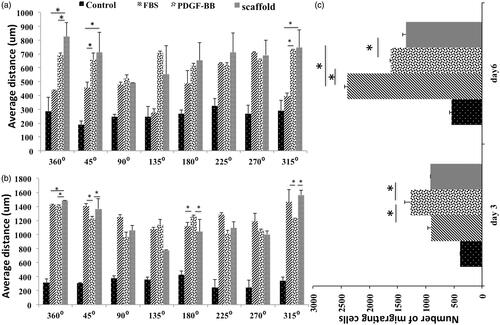
Figure 5. Total number of migrating cells at each position of central well circumference, day 3 (a) and day 6 (b). Cell counting in different zones of 8 positions at day 3 (c).
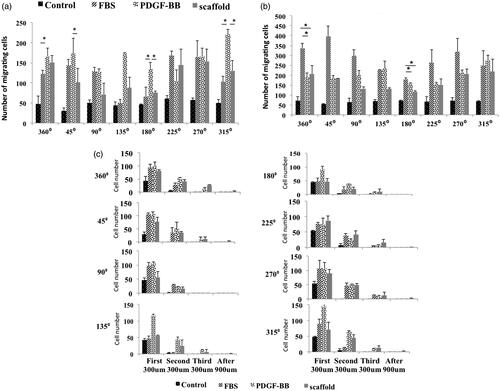
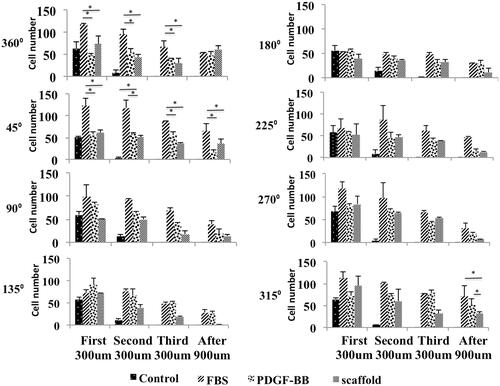
Figure 6. Cell counting in different zones of 8 positions at day 6.