Figures & data
Figure 1. Chemical structure of TanIIA.
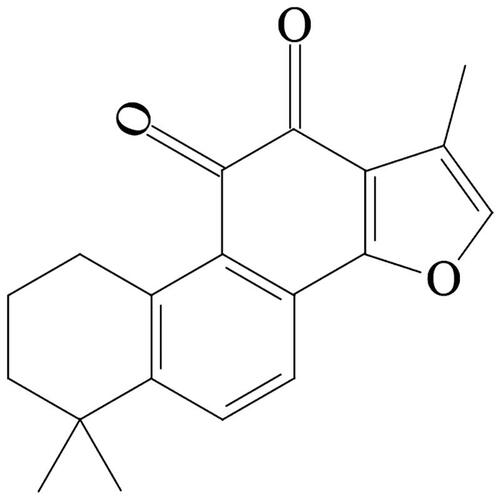
Figure 2. Size distribution (a) and TEM images (b) of TanIIA@MSNs (A), TanIIA@LB-MSNs (B) and TanIIA@Bio-LB-MSNs (C). Scale bars for TEM images are 100 nm, 50 and 50 for A, B and C, respectively.
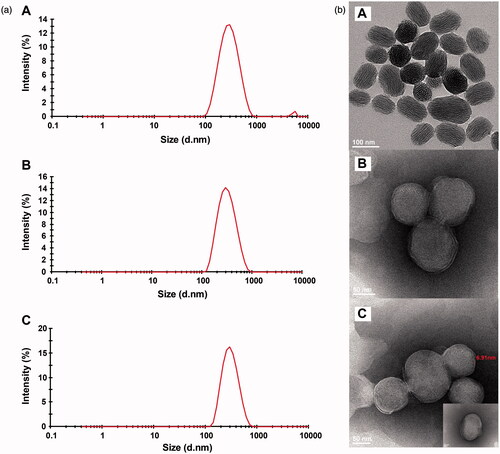
Figure 3. FTIR spectra of the Bio-liposomes, TanIIA@MSNs and TanIIA@Bio-LB-MSNs.
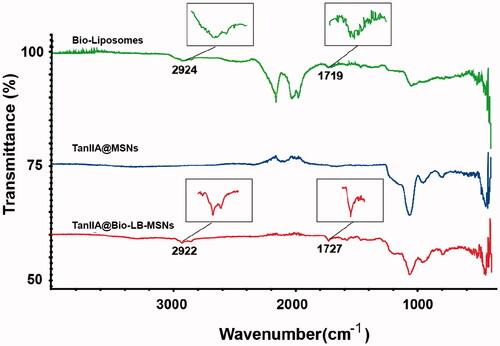
Figure 4. The nitrogen adsorption–desorption isotherms of the MSNs and TanIIA@MSNs.
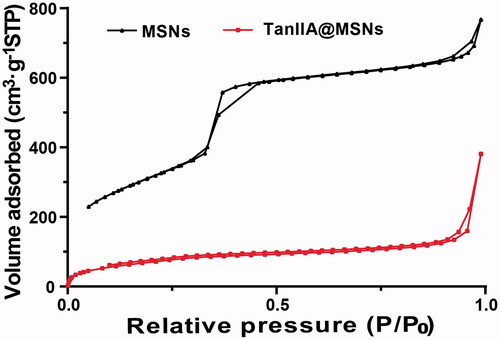
Table 1. Characterization concerning the size, polydispersity and zeta potential of TanIIA@MSNs, TanIIA@LB-MSNs and TanIIA@Bio-LB-MSNs.
Table 2. The nitrogen adsorption–desorption characteristic parameters of MSNs and TanIIA@MSNs.
Figure 5. DSC thermograms (a) and XRD curves (b) of the pure TanIIA powder (A), PM (B), TanIIA@MSNs (C), TanIIA@LB-MSNs (D) and TanIIA@ Bio-LB-MSNs (E).
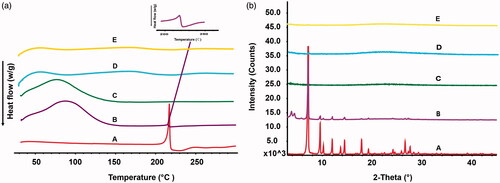
Figure 6. Confocal laser scanning microscopy (CLSM) images (a) and Flow cytometry (b) of Caco-2 cells incubated with Cou-6@MSNs, Cou-6@LB-MSNs, Cou-6@Bio-LB-MSNs or free biotin solution pretreated Cou-6@Bio-LB-MSNs for 1.5 h at 37 °C. (Scale bars for CLSM images are 25 μm. From left to right, cell nuclei stained by Hoechst 33258 (blue), nanoparticles labelled by Cou-6 (green) and the merge of the two images. The cells without any treatment were used as control).
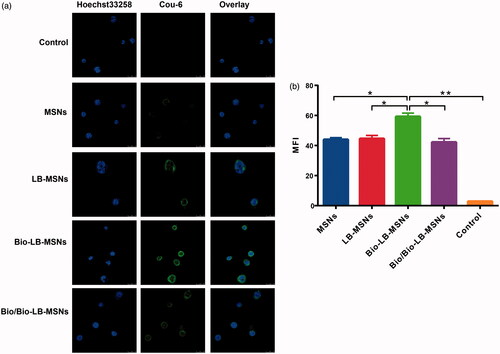
Figure 7. In vitro release profiles of the pure TanIIA powder, TanIIA@MSNs, TanIIA@LB-MSNs and TanIIA@Bio-LB-MSNs. (n = 3).
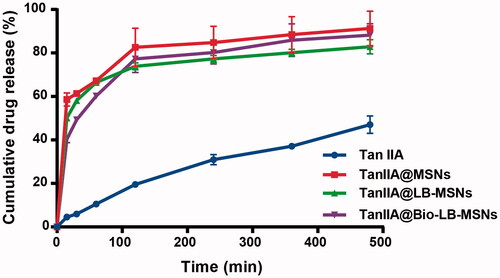
Table 3. The Papp of TanIIA solution, TanIIA@MSNs, TanIIA@LB-MSNs and TanIIA@Bio-LB-MSNs in jejunum (n = 3).
Figure 8. Plasma concentration–time profiles of the pure TanIIA powder, TanIIA@MSNs, TanIIA@LB-MSNs and TanIIA@Bio-LB-MSNs following oral administration in SD rats at a dose of 35 mg/kg (n = 5).
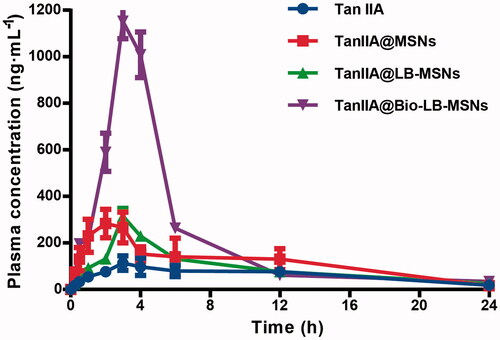
Table 4. Main pharmacokinetic parameters of the pure TanIIA powder, TanIIA@MSNs, TanIIA@LB-MSNs and TanIIA@Bio-LB-MSNs after oral administration to SD rats at a dose of 35 mg·kg−1 (n = 5).
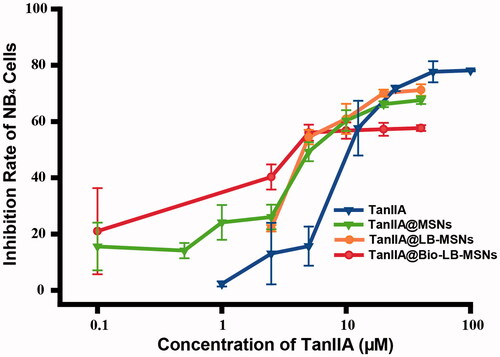
Figure 9. Growth inhibition rate on NB4 cells treated with different samples for 24 h measured by CCK-8 assay.