Figures & data
Figure 1. KLF16 expression is reduced in glioma tissues and cell lines. (A and B) Western blotting analysis of KLF16 expression in normal human astrocyte (NHA) cells and 6 glioma cell lines (A) and in two normal brain tissues and eight human glioma tissues (B). GAPDH served as the loading control. (C and D) Real-time PCR analysis of KLF16 expression in NHA and 6 glioma cell lines (C) and in two normal brain tissues and eight human glioma tissues (D). Transcript levels were normalized to GAPDH expression. *p < .05 vs. NHA cells.
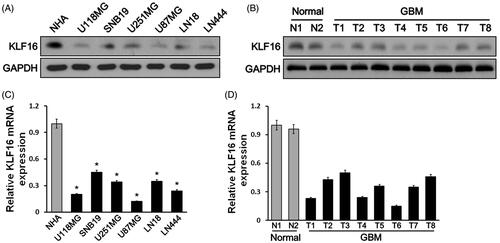
Figure 2. KLF16 is associated with better prognosis of glioma patients. (A) Analysis of TCGA mRNA array data revealed that KLF16 levels were significantly downregulated in human primary GBMs (n = 110) compared with normal brain tissues (n = 26). (B) Survival analysis of glioma patients with high and low KLF16 expression level.
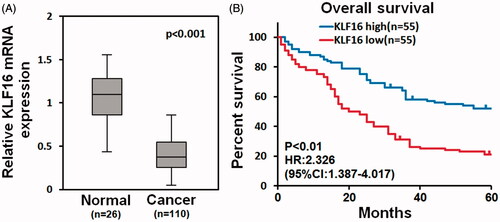
Figure 3. KLF16-regulated glioma cell proliferation. (A) Real-time PCR analysis of KLF16 expression in U87MG cells infected with KLF16 plasmid or KLF16 siRNA. mRNA expression levels were normalized to GAPDH. (B) Colony formation assay demonstrated the influence of KLF16 on U87MG cell clone formation ability. (C) MTT assays revealed that KLF16 downregulation induced proliferation of U87MG cells. (D) Representative micrographs and quantification of TUNEL incorporation in KLF16 overexpression and silencing cells. (E) Flow cytometric analysis of cell cycle in KLF16 overexpression and silencing glioma cells. *p < .05.
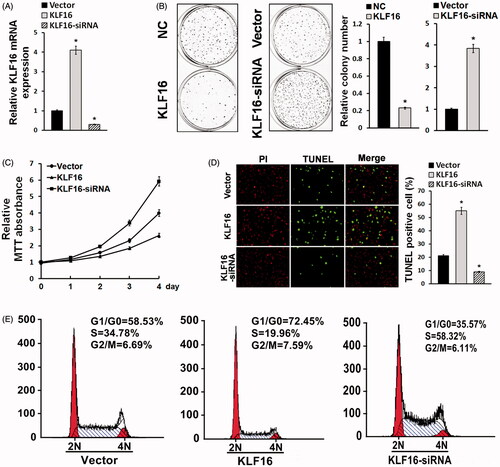
Figure 4. KLF16 overexpression inhibits glioma cell tumourigenicity. (A) Representative micrographs and quantification of colonies produced in an anchorage independent growth assay. Colonies larger than 0.05 mm in diameter were scored. Scale bars: 50 μm. (B) A xenograft model in nude mice. The indicated cells were injected into the dorsal flank of the mice. Tumour-bearing mice were euthanized and imaged on day 40. (C) Tumour volumes were measured on the indicated days. (D) Mean tumour weights. (E) Proliferation index was determined by counting the proportion of Ki67-positive cells. *p < .05.
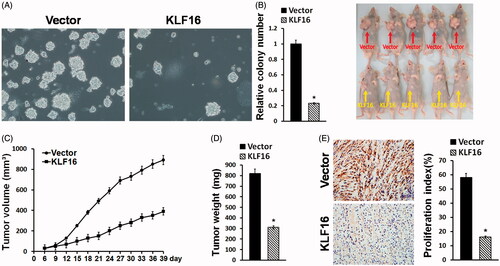
Figure 5. KLF16 inhibits glioma cell proliferation via TFAM downregulation. (A) Real-time PCR analysis of TFAM expression in KLF16-overexpressing and KLF16-silenced cells compared with controls. Transcript levels were normalized to GAPDH expression. (B) Luciferase assay of the indicated cells transfected with pGL3-FOXO1. (C and D) Western blotting analysis of cyclin D1, cyclin E, p21, p-FOXO1, FOXO1, p-Rb and Rb expression in the indicated cells. GAPDH served as the loading control. (E) Percentage of TUNEL incorporating cells in KLF16-overexpressing, KLF16-overexpressing plus TFAM overexpressing and control cells. (F) Percentage of TUNEL positive cells in KLF16-silenced, KLF16-silenced plus TFAM inhibited and control cells. Each bar represents the mean ± SD of three independent experiments. *p < .05.
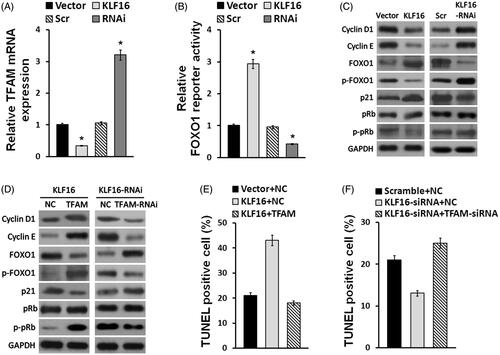
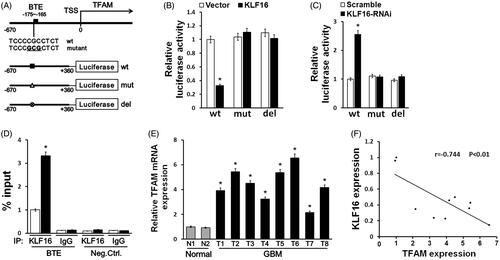
Figure 6. KLF16 directly represses TFAM expression and is clinically relevant. (A) Schematic illustration of the predicted BTE site and the cloned luciferase reporter containing the TFAM promoter. BTE was mutated or deleted to verify that the site is essential for KLF16 regulation. (B) The effect of KLF16 on the transactivation of the TFAM promoter with or without BTE site. (C) The effect of KLF16-siRNA on the transactivation of the TFAM promoter with or without BTE site. (D) Regions of the promoter physically associated with KLF16 were analysed using the ChIP assay. (E) Real-time PCR analysis of TFAM expression in 2 normal brain tissues and 8 human glioma tissues. (F) Reduced KLF16 expression significantly correlated with TFAM overexpression in glioma samples. Each bar represents the mean ± SD of three independent experiments. *p < .05.