Figures & data
Table 1. Primers sequences used in this study.
Figure 1. The signalling pathways that associated with ROCK1 in control and SrR treated OVX-rBMSCs. (a, b) The signalling pathways that associated with ROCK1 in control (n = 3) and SrR treated OVX-rBMSCs (n = 3) were analysed by GSEA, and GSEA details of TGF-β and chemokine signalling pathway were shown in C and D. * indicates the ROCK1 expression.
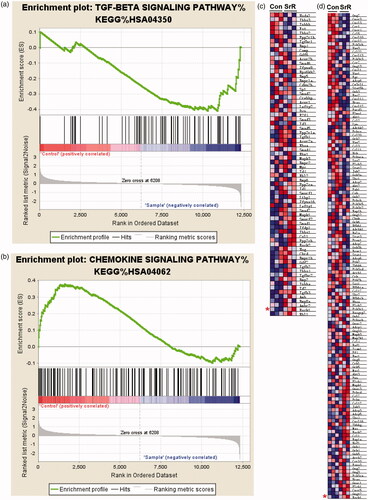
Table 2. Gene expression differed in OVX-rBMSCs treated with SrR or not.
Figure 2. SrR treatment increased ROCK1 expression and viability of osteoclasts. The expression of ROCK1 in OVX-rBMSCs was measured by real-time PCR (a) and western blotting (b, c). The cell viability of osteoclasts and the expression of ROCK1 in OVX-rBMSCs were measured by CCK-8 (d), real-time PCR (e) and western blotting (b, f). *p < .05, **p < .01 compared with control.
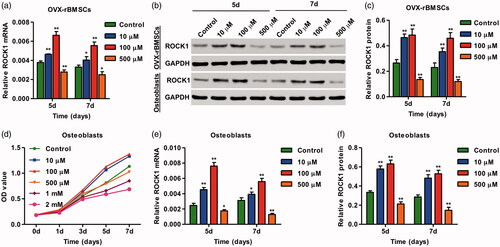
Figure 3. ROCK1 regulated the osteogenesis of OVX-rBMSCs. After transfection of OVX-rBMSCs with pLVXPuro-ROCK1 (a) and pLKO.1-puro-ROCK1-shRNA (b), the expression of ROCK1 was measured by real-time PCR, the activity of ALP was shown in (c), and the expression of Runx-2, ALP and OPN was measured by real-time PCR (d) and western blotting (e, f). **p < .01 compared with Vector. ##p < .01 compared with shRNA.
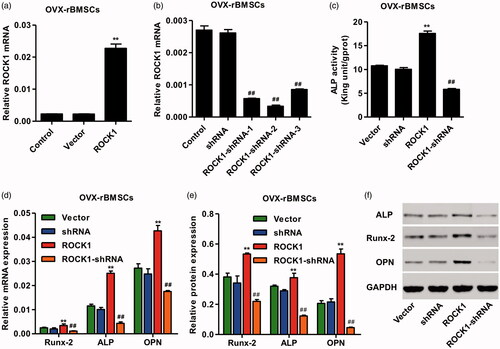
Figure 4. ROCK1 regulated the viability and apoptosis of osteoclasts. After transfection of osteoclasts with pLVX-Puro-ROCK1 (a) and pLKO.1-puro-ROCK1-shRNA (b), the expression of ROCK1 was measured by real-time PCR, the cell viability and apoptosis was measured by CCK-8 (c) and flow cytometry (d, e), and the expression of ALP, PCNA, Bcl-2 and Bax was measured by western blotting (f, g) and real-time PCR (h). **p < .01 compared with Vector. ##p < .01 compared with shRNA.
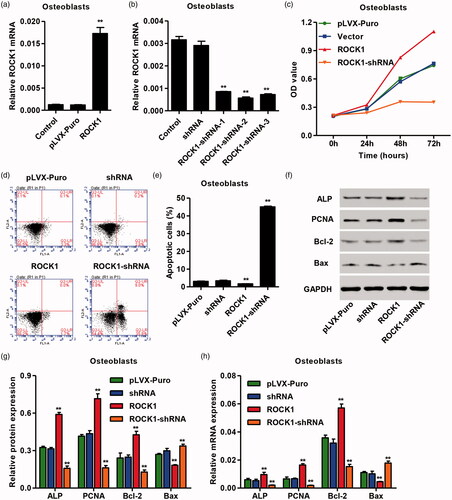
Figure 5. Effects of SrR and Y-27632 on the osteogenesis of OVX-rBMSCs and the viability and apoptosis of osteoclasts. After treatment of OVX-rBMSCs and osteoclasts with SrR and/or Y-27632, the ALP activity (a) as well as the gene expression of Runx-2, ALP and OPN (b) in OVX-rBMSCs was measured. The protein expression of RUNX-2 ALP and OPN was measured by western blotting (i, j). The cell viability and apoptosis was measured by CCK-8 (e) and flow cytometry (f, g), and the expression of ALP, PCNA, Bcl-2 and Bax in osteoclasts was measured by real-time PCR (h) and western blotting (i, j). **p < .01 compared with control. ##p < .01 compared with SrR. ΔΔp < .01 compared with Y-27632.
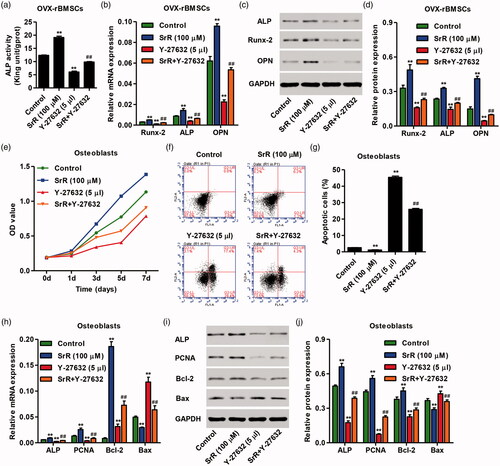
Figure 6. Characteristics of nano-HAp particles. The FESEM images of the nano-structured HAp (Nano-HAp) sample with low (a) and high (b) magnification. The XRD (c) and FTIR (d) patterns of the nano-structured HAp materials. (e) Curve of releasing SrR from the HAp particulates.
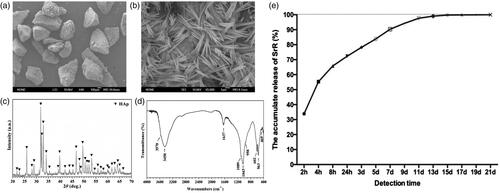
Figure 7. Micro-CT evaluation and morphometric analysis of femur bone repair and angiogenesis. (a) The wound healing was satisfactory after surgery. (b) Representative 3D superficial image of femur bone defects. (c–f) Quantitative analysis of micro-CT data. (g) Three-dimensional reconstruction of blood vessel. The left two pictures show the three-dimensional reconstructions of blood vessel tissue in control and SrR groups, the picture on the top right corner presents the direction of the 3D reconstruction pictures, and the down right corner shows the quantitative data. (h, i) CD31 immunohistochemical staining and quantitative data. *p < .05 compared with control.
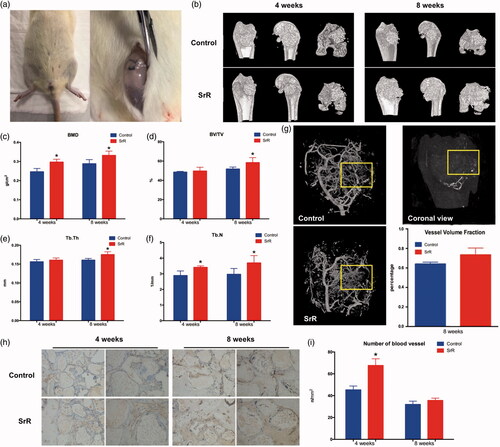
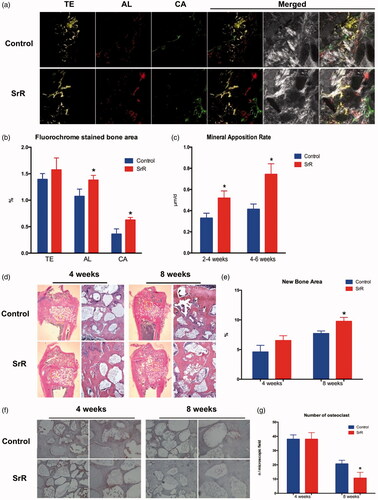
Figure 8. Sequential fluorescence labelling and histological images of newly formed bone in femur defects. (a) Confocal laser scanning of sequential fluorescent labelling on new bones. The yellow fluorescence represents the tetracycline (TE) of 2 weeks, the red fluorescence represents alizarin red (AL) of 4 weeks and the green represent the calcein (CA) of 6 weeks. The last two pictures showed the sections under light microscope (magnification 100×). (b, c) The histograms showed the result of qualitative analysis. (d, e) H&E staining and quantitative analysis. The left rows are in magnification 12.5×, right rows are in magnification 100×. (f, g) TRAP staining and quantitative analysis. The left rows are in magnification 100×, right rows are in magnification 200×. *p < .05 compared with control.