Figures & data
Table 1. Mean hydrodynamic particle size, polydispersion index (PDI), zeta potential, EE and LC of SLNs, SLNs-RIF, M-SLNs and M-SLNs-RIF.
Figure 1. Infrared spectra of RIF, PM, SLNs, SLNs-RIF, M-SLNs and M-SLNs-RIF (n = 3). (A) RIF, PM, SLNs and SLNs-RIF. (B) SLNs, SLNs-RIF, M-SLNs and M-SLNs-RIF. (C) M-SLNs-RIF and SLNs-RIF and Schiff´s base. M-SLN-RIF: rifampicin-loaded mannosylated solid lipid nanoparticles; M-SLNs: mannosylated solid lipid nanoparticles; SLN RIF: rifampicin-loaded solid lipid nanoparticles; SLNs: solid lipid nanoparticles; PM: physical mixture; RIF: rifampicin.
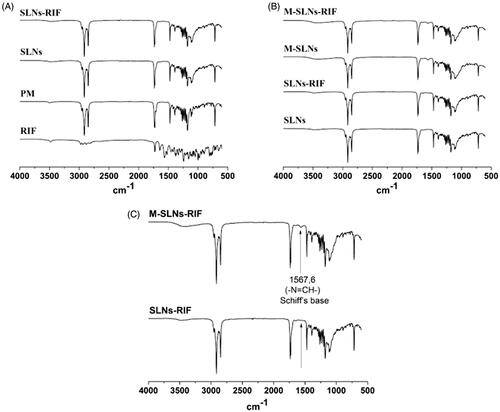
Figure 2. Transmission electron photomicrographs of (A) SLNs, (B) SLN-RIF, (C) M-SLNs and (D) M-SLN-RIF (n = 3). (Scale bar: 200 nm). M-SLN-RIF: rifampicin-loaded mannosylated solid lipid nanoparticles; M-SLNs: mannosylated solid lipid nanoparticles; SLN RIF: rifampicin-loaded solid lipid nanoparticles; SLNs: solid lipid nanoparticles.
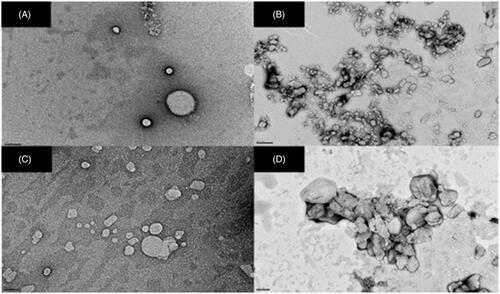
Figure 3. In vitro RIF release profile of SLNs-RIF and M-SLN-RIF in pH 7,4 (A), pH 6,2 (B) and pH 4,5 (C), in order to simulate the release of the drug in following pulmonary administration until it has reached the acidic vesicles phagosomes and phagolysosomes (n = 3). RIF: rifampicin; M-SLNs-RIF: rifampicin-loaded mannosylated solid lipid nanoparticles; SLNs-RIF: rifampicin-loaded solid lipid nanoparticles.
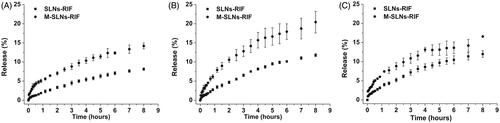
Figure 4. DSC thermograms Infrared spectra of Glycerol palmitate, PM, SLNs, SLNs-RIF, M-SLNs and M-SLNs-RIF (n = 3). M-SLN-RIF: rifampicin-loaded mannosylated solid lipid nanoparticles; M-SLNs: mannosylated solid lipid nanoparticles; SLN RIF: rifampicin-loaded solid lipid nanoparticles; SLNs: solid lipid nanoparticles; PM: physical mixture.
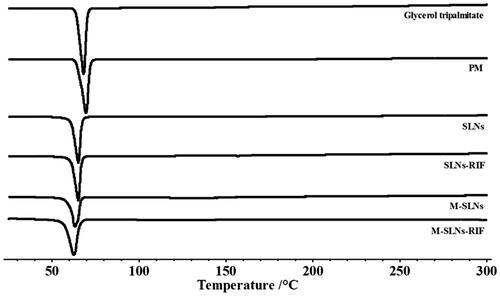
Table 2. Results of the kinetic parameters of the drug release profile obtained for M-SLN-RIF: determination coefficient (R2).
Table 3. Differential scanning calorimetry parameters of SLNs, SLNs-RIF, M-SLNs and M-SLNs-RIF.
Figure 5. Effect of storage time (at room temperature) on particle diameter, PDI and zeta-potential (ZP) of SLNs-RIF and M-SLNs-RIF during 180 days (mean ± SD, n = 3). SLNs-RIF: rifampicin-loaded solid lipid nanoparticles; M-SLNs-RIF: rifampicin-loaded mannosylated solid lipid nanoparticles; PDI: polydispersity index; SD: standard deviation; ZP: zeta potential.
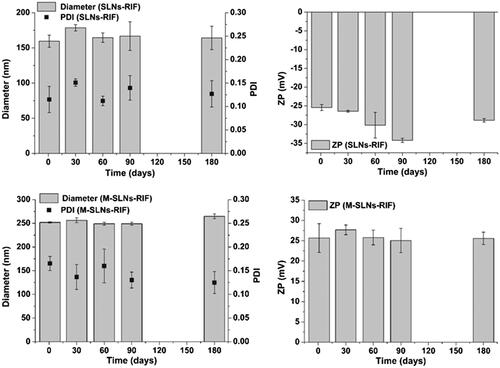
Figure 6. Cell viability of THP1 differentiated macrophages upon exposure to free RIF, placebo and RIF-loaded SLNs and M-SLNs. Data expressed as average ± standard deviation (n = 5 of three independent assays). RIF: rifampicin; SLNs: solid lipid nanoparticles; SLNs-RIF: rifampicin-loaded solid lipid nanoparticles; M-SLNs: mannosylated solid lipid nanoparticles; M-SLNs-RIF: rifampicin-loaded mannosylated solid lipid nanoparticles.
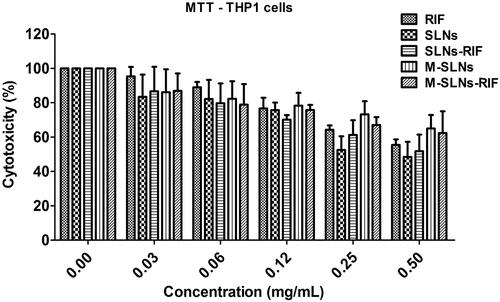
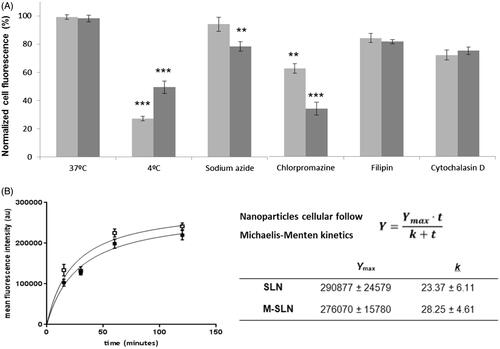
Figure 7. Cellular interaction of nanoparticles on THP1 macrophages. (A) Role of energy in the internalization of SLNs (light grey) and M-SLNs (dark grey), using 37 °C as control. (B) Cellular uptake kinetic profiles obtained by flow cytometry for SLNs (□) and M-SLNs (▪). Data expressed as mean ± SD (n = 3). Statistical differences in relation to control (37 °C) represented as **P < .01 and ***P < .001.