Figures & data
Figure 1. Characterization of the CANE. (A) Average droplet size and polydispersity index of synthesized CANE measured with the help of DLS. (B) Zeta potential of synthesized CANE. (C) Scanning electron microscopic (SEM) image of CANE and its histogram size distribution [Scale bar =1 μm].
![Figure 1. Characterization of the CANE. (A) Average droplet size and polydispersity index of synthesized CANE measured with the help of DLS. (B) Zeta potential of synthesized CANE. (C) Scanning electron microscopic (SEM) image of CANE and its histogram size distribution [Scale bar =1 μm].](/cms/asset/e3dde525-3c67-4a1c-b1a2-3bd88ec46030/ianb_a_1434187_f0001_c.jpg)
Figure 2. Cytotoxic potential of CANE against A549DR cells. (A) and (B) MTT and LDH assay, respectively, of CANE (5–100 μg/ml)-treated A549DR cells after 24 h of incubation. Emulsion without carvacrol was also used as a control. (C) MTT assay of CANE (25–100 μg/ml)-treated normal bronchial epithelium cells (BEAS-2B). (D) Morphological changes in A549DR cells after treatment with CANE (25–100 μg/ml). Images were captured at 40× magnification [scale bar= 0.1 mm]. (E) Clonogenic assay, A549DR cells were cultured in the presence and absence of CANE over 7 days, followed by crystal violet staining. (F) Soft agar colony assays showed that CANE treatment led to a significant decrease in anchorage-independent colony-forming ability of A549DR cells. (G) The ABCB, MDR protein found to be overexpressed in prepared DR cells. Densitometry analysis was determined by Image J software.
![Figure 2. Cytotoxic potential of CANE against A549DR cells. (A) and (B) MTT and LDH assay, respectively, of CANE (5–100 μg/ml)-treated A549DR cells after 24 h of incubation. Emulsion without carvacrol was also used as a control. (C) MTT assay of CANE (25–100 μg/ml)-treated normal bronchial epithelium cells (BEAS-2B). (D) Morphological changes in A549DR cells after treatment with CANE (25–100 μg/ml). Images were captured at 40× magnification [scale bar= 0.1 mm]. (E) Clonogenic assay, A549DR cells were cultured in the presence and absence of CANE over 7 days, followed by crystal violet staining. (F) Soft agar colony assays showed that CANE treatment led to a significant decrease in anchorage-independent colony-forming ability of A549DR cells. (G) The ABCB, MDR protein found to be overexpressed in prepared DR cells. Densitometry analysis was determined by Image J software.](/cms/asset/76d6b0bd-5b45-4395-85f1-f878ca892584/ianb_a_1434187_f0002_c.jpg)
Figure 3. CANE induces apoptotic morphology and oxidative stress in A549DR. (A) The apoptotic morphology detected with the help of Hoechst–Propidium iodide staining and quantification done with the help of image J software. Apoptotic cells were calculated as percent apoptotic nuclei compared with a total number of cells. (B) and (C) The oxidative stress induction by CANE in A549DR evaluated with the help of H2DCHFDA (cellular ROS) and Mito-Sox (mitochondrial ROS). Image J software was used for quantification of oxidative stress. Images were taken at 40× magnification [scale bar= 0.1 mm]. Each value in the graph represents as the mean ± SD of three independent experiments. Values with different superscripts differ significantly from each other (p < .05).
![Figure 3. CANE induces apoptotic morphology and oxidative stress in A549DR. (A) The apoptotic morphology detected with the help of Hoechst–Propidium iodide staining and quantification done with the help of image J software. Apoptotic cells were calculated as percent apoptotic nuclei compared with a total number of cells. (B) and (C) The oxidative stress induction by CANE in A549DR evaluated with the help of H2DCHFDA (cellular ROS) and Mito-Sox (mitochondrial ROS). Image J software was used for quantification of oxidative stress. Images were taken at 40× magnification [scale bar= 0.1 mm]. Each value in the graph represents as the mean ± SD of three independent experiments. Values with different superscripts differ significantly from each other (p < .05).](/cms/asset/c8e66f84-9740-4694-b27c-90eb17f6b58c/ianb_a_1434187_f0003_c.jpg)
Figure 4. CANE induces cell senescence and cell cycle arrest. (A) Senescence-associated β-galactosidase (SA-β-Gal) staining of A549DR cells. The percentage of SA-β-Gal-positive cells was calculated from 5 randomly chosen fields. At least 100 cells were analyzed per experiment, each value in the graph represents as the mean ± SD of three independent experiments. Values with different superscripts differ significantly from each other (p < .05). (B) CANE was treated to A549DR cells for 24 h and cell cycle protein levels detected such as CDK2, CDK4, CDK6, Cyclin E, Cyclin D1 and p21. Densitometry analysis of the respective proteins was evaluated by Image J software, and results were normalized with β-actin.
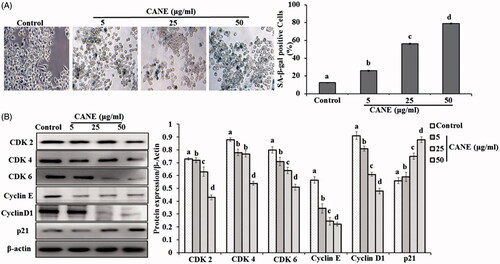
Figure 5. CANE abolishes autophagy in A549DR. (A) CANE was treated to A549DR cells for 24 h and autophagic protein levels detected such as LC-3, p62, Beclin-1, mTOR, ATG5 and ATG7. Densitometry analysis of the respective proteins was evaluated by Image J software, and results were normalized with β-actin with respect to controls. (B) For further confirmation, autophagic vacoule formation detected with the help of fluorogenic dye LysoTracker® Red, DAPI was used as counter stain to stain nucleus. Acridine orange was used to detect the autopaghic vacoule formation. Image J software was used for quantification of oxidative stress. Images were taken at 40× magnification [scale bar= 0.1 mm]. Each value in the graph represents as the mean ± SD of three independent experiments. Values with different superscripts differ significantly from each other (p < .05).
![Figure 5. CANE abolishes autophagy in A549DR. (A) CANE was treated to A549DR cells for 24 h and autophagic protein levels detected such as LC-3, p62, Beclin-1, mTOR, ATG5 and ATG7. Densitometry analysis of the respective proteins was evaluated by Image J software, and results were normalized with β-actin with respect to controls. (B) For further confirmation, autophagic vacoule formation detected with the help of fluorogenic dye LysoTracker® Red, DAPI was used as counter stain to stain nucleus. Acridine orange was used to detect the autopaghic vacoule formation. Image J software was used for quantification of oxidative stress. Images were taken at 40× magnification [scale bar= 0.1 mm]. Each value in the graph represents as the mean ± SD of three independent experiments. Values with different superscripts differ significantly from each other (p < .05).](/cms/asset/22f1bfa7-6683-4f76-ab97-ebbb5b7e15a8/ianb_a_1434187_f0005_c.jpg)
Figure 6. CANE inhibits autophagy in A549DR cells. (A) Effects of autophagy inhibition by 3-MA on CANE-induced cell death evaluated by MTT assay. (B) Autophagic vacuole formation is inhibited in presence of 3-MA as well as 3-MA in combination with CANE. Image J software was used for quantification of oxidative stress. Images were taken at 40× magnification [scale bar= 0.1 mm]. (C) Western blotting of autophagy as well as apoptosis markers in presence of 3-MA, β-actin used as loading control. Densitometry analysis was determined by Image J software. Each value in the graph represents as the mean ± SD of three independent experiments. Values with different superscripts differ significantly from each other (p < .05).
![Figure 6. CANE inhibits autophagy in A549DR cells. (A) Effects of autophagy inhibition by 3-MA on CANE-induced cell death evaluated by MTT assay. (B) Autophagic vacuole formation is inhibited in presence of 3-MA as well as 3-MA in combination with CANE. Image J software was used for quantification of oxidative stress. Images were taken at 40× magnification [scale bar= 0.1 mm]. (C) Western blotting of autophagy as well as apoptosis markers in presence of 3-MA, β-actin used as loading control. Densitometry analysis was determined by Image J software. Each value in the graph represents as the mean ± SD of three independent experiments. Values with different superscripts differ significantly from each other (p < .05).](/cms/asset/3eba6c1f-18c5-4753-93fa-7c8ac51e1c2e/ianb_a_1434187_f0006_c.jpg)
Figure 7. CANE induces mitochondrial-mediated apoptosis. CANE (0–50 μg/ml) induces apoptosis in A549DR via mitochondrial-mediated pathway. (A) Apoptotic protein levels (JNK, p-JNK, Bax, Bcl2, Cyto C, Caspase-9 and Caspase-3). Densitometry analysis of the respective proteins was evaluated by Image J software, and results were normalized with β-actin with respect to controls. (B) Fluorescent images of the cells representing mitochondrial membrane potential (Rhodamine 123). Image J software was used to determine the mean fluorescence intensity. Each value in the graphs represents as the mean ± SD of three independent experiments. Values with different superscripts differ significantly from each other (p < .05). (C) Immunocytochemical analysis of activities of caspase-3. Images show double staining using antibody against caspase (C-caspase) and DAPI to view nuclei in the same cells. Cleaved caspase-3 indicating activities of these enzymes, are stained green; DAPI staining of nuclei (blue) was performed to identify dead cells as indicated by condensed nuclei. Images were captured at 40× magnification [scale bar= 0.1 mm].
![Figure 7. CANE induces mitochondrial-mediated apoptosis. CANE (0–50 μg/ml) induces apoptosis in A549DR via mitochondrial-mediated pathway. (A) Apoptotic protein levels (JNK, p-JNK, Bax, Bcl2, Cyto C, Caspase-9 and Caspase-3). Densitometry analysis of the respective proteins was evaluated by Image J software, and results were normalized with β-actin with respect to controls. (B) Fluorescent images of the cells representing mitochondrial membrane potential (Rhodamine 123). Image J software was used to determine the mean fluorescence intensity. Each value in the graphs represents as the mean ± SD of three independent experiments. Values with different superscripts differ significantly from each other (p < .05). (C) Immunocytochemical analysis of activities of caspase-3. Images show double staining using antibody against caspase (C-caspase) and DAPI to view nuclei in the same cells. Cleaved caspase-3 indicating activities of these enzymes, are stained green; DAPI staining of nuclei (blue) was performed to identify dead cells as indicated by condensed nuclei. Images were captured at 40× magnification [scale bar= 0.1 mm].](/cms/asset/eb22bb73-1bab-4654-ab4e-63d8fc3a91c0/ianb_a_1434187_f0007_c.jpg)
Figure 8. NAC mitigates the CANE induced mitochondrial-mediated apoptosis in A549DR cells. (A) Effects of ROS scavenger NAC on CANE-induced cell death evaluated by MTT assay. (B) CANE-induced ROS production abolished H2DCFDA fluorescence in presence of NAC. Images were taken at 40× magnification [scale bar= 0.1 mm]. (C) Western blotting of apoptosis pathway markers, β-actin used as loading control. Densitometry analysis was determined by Image J software. Each value in the graph represents as the mean ± SD of three independent experiments. Values with different superscripts differ significantly from each other (p < .05).
![Figure 8. NAC mitigates the CANE induced mitochondrial-mediated apoptosis in A549DR cells. (A) Effects of ROS scavenger NAC on CANE-induced cell death evaluated by MTT assay. (B) CANE-induced ROS production abolished H2DCFDA fluorescence in presence of NAC. Images were taken at 40× magnification [scale bar= 0.1 mm]. (C) Western blotting of apoptosis pathway markers, β-actin used as loading control. Densitometry analysis was determined by Image J software. Each value in the graph represents as the mean ± SD of three independent experiments. Values with different superscripts differ significantly from each other (p < .05).](/cms/asset/b2a10117-252e-45cc-90a6-f7d608ca0551/ianb_a_1434187_f0008_c.jpg)
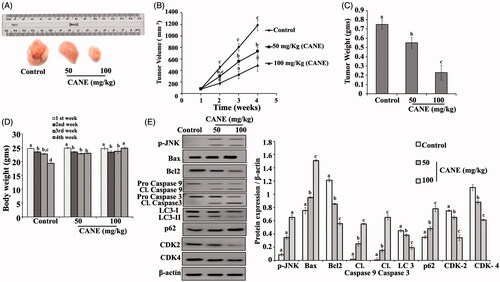
Figure 9. In vivo study. CANE inhibits tumour growth. (A) Tumour images excised from different groups of mice after 4 weeks. (B) Tumour volume with respect to time. (C) Tumour weight after 4 weeks. (D) Body weight with respect to time. (E) Expression of p-JNK, Bax, Bcl2, caspase-9, caspase-3, LC-3, p62, CDK2, CDK4 and β-actin in tumour tissue. Each value in the bar graph represents the mean ± SD of three independent experiments. Values with different superscripts differ significantly from each other (p < .05).