
Figures & data
Figure 1. General layout of the study; from biosynthesis to application.
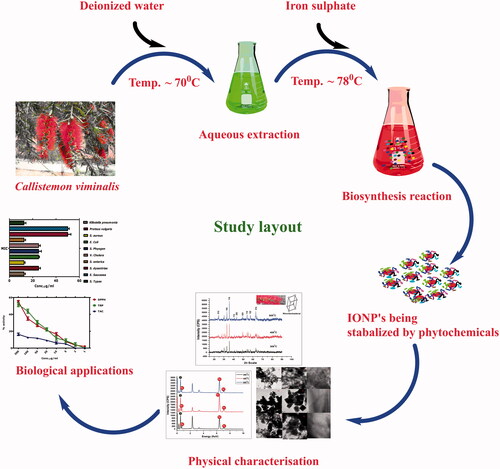
Figure 2. Schematic representation of the plausible biosynthesis mechanism.
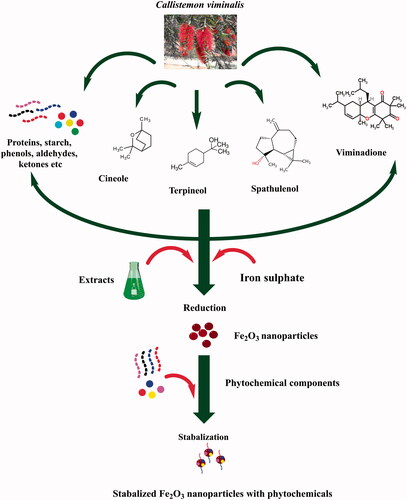
Figure 3. XRD spectra of biogenic IONPs after annealing them at various temperatures.
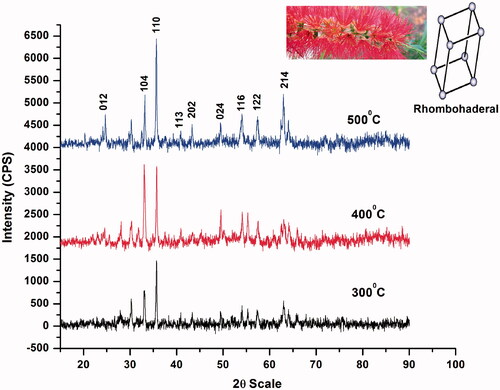
Table 1. Size and lattice strain measured using XRD.
Figure 4. (A–C) HR-SEM images of biogenic IONPs; (D–F) their SAED pattern.
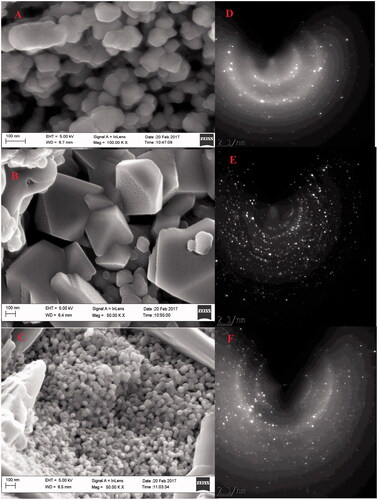
Figure 5. (A–C) HR-TEM images of biogenic IONPs annealed at 300 °C; (D–F) at 400 °C; (G–I) at 500 °C.
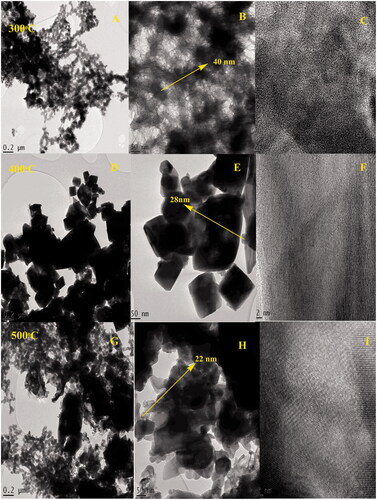
Figure 6. (A) UV absorption spectra of biogenic IONPs at 300, 400 and 500 °C (B) EDS spectra.
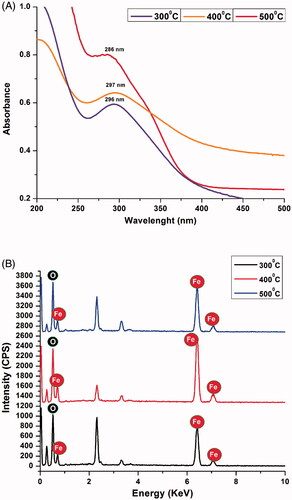
Figure 7. (A) FTIR spectrum of biogenic IONPs at 300, 400 and 500 °C (B) Magnetization curves of biogenic iron oxide nanoparticles.
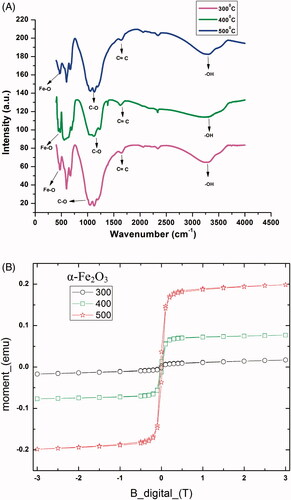
Table 2. Coercivity values measured for each IONP sample.
Figure 8. Antieleishmanial potential of biogenic IONPs.
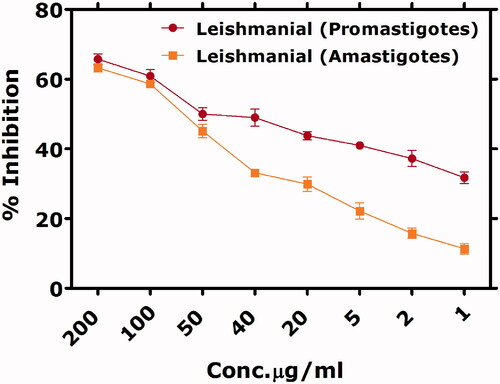
Figure 9. Anticancer potential of bioinspired IONPs.
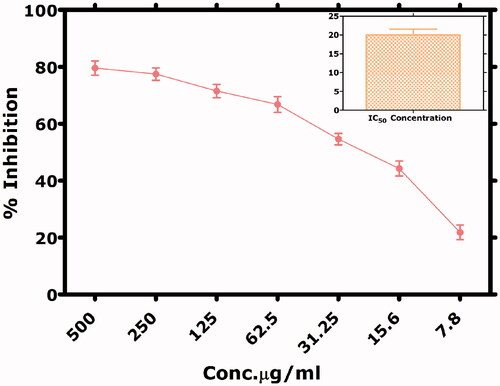
Figure 10. Possible cytotoxic mechanism. (A) Extracellular ROS generations (which can easily penetrateinside the cell) followed by their interference with nuclear material, leading to genotoxicity. (B) IONPs are internalized by receptor-mediated endocytosis, followed by their entry into the lysosomes, where Fe2+ dissolution occurs. (C) Surface defects in IONP?s can result in rupturing of cellular membranes. The mechanism have been developed through the work ofearlier researchers. (D) The generated ions not only interfere with other proteins, but also make their way into the mitochondria, where they disrupt its function by creating further ROS. Adapted from [Citation11].
![Figure 10. Possible cytotoxic mechanism. (A) Extracellular ROS generations (which can easily penetrateinside the cell) followed by their interference with nuclear material, leading to genotoxicity. (B) IONPs are internalized by receptor-mediated endocytosis, followed by their entry into the lysosomes, where Fe2+ dissolution occurs. (C) Surface defects in IONP?s can result in rupturing of cellular membranes. The mechanism have been developed through the work ofearlier researchers. (D) The generated ions not only interfere with other proteins, but also make their way into the mitochondria, where they disrupt its function by creating further ROS. Adapted from [Citation11].](/cms/asset/19ec74ad-d4fd-479b-b1ff-f70f0b92e428/ianb_a_1434534_f0010_c.jpg)
Figure 11. MIC’s of tested bacterial strains using biogenic IONPs.
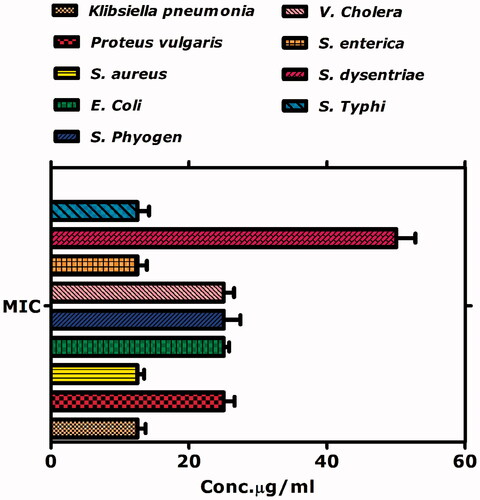
Table 3. Antibacterial activities of biogenic iron oxide nanoparticles.
Figure 12. Enzyme inhibition potential of biomodulated IONPs.
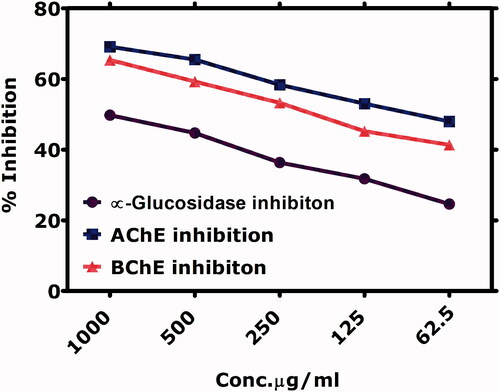
Figure 13. Schematic representation of the inhibition of choline esterase by magnetic IONPs. (A,B) indicate the formation of acetyle choline which is catalyzed by acetyle choline transferase enzyme in the transmitting neurons. (C) indicate the normal conditions where acetyle choline can reach the reciveing neurons. (D) in the presence of choline esterases, acetyle choline is degraded and is unable to transmit the signal. (E) shows nanoparticles inhibitng the choline esterase enzyme which allows the neurotransmitter to transmit the signal.
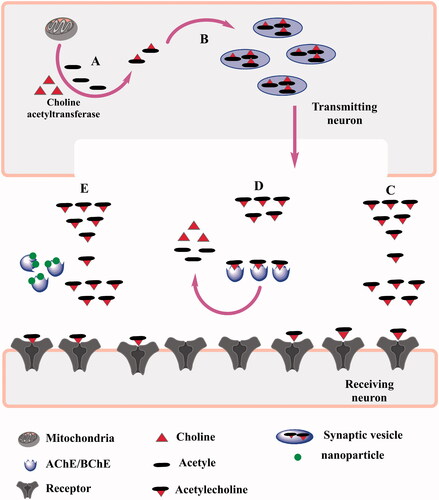
Figure 14. Antioxidant potential of biogenic IONPs.
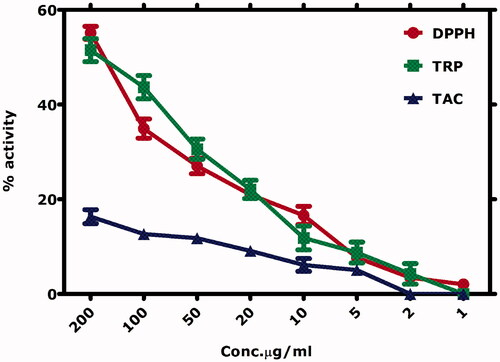
Figure 15. Hemolytic activity of bioinspired IONPs against RBC’s.
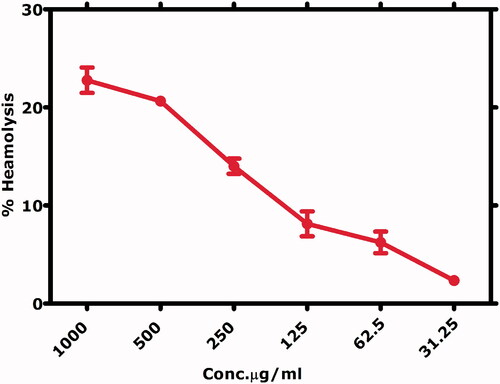
Table 4. IC50 Values calculated for various biological assays.