Figures & data
Table 1. Primer sequences used for real time-PCR in this study.
Figure 1. Morphological changes of cultured cells in tissue culture plates. (a) hiPSCs in DMEM (control group). (b) hiPSCs in IPC differentiation media at day 21. Scale bars are 100 µm.
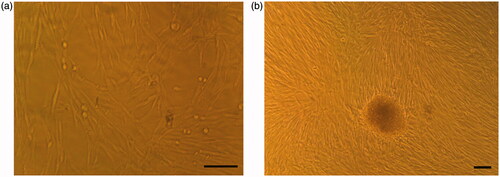
Figure 2. Morphological changes of cultured cells on the PES nanofibrous scaffold. (a) Unseeded scaffold with interconnected pores. (b) hiPSCs-seeded on the nanofibrous scaffold (control group). The cells show spindle-shaped morphology. (c) The hiPSCs-seeded scaffold in IPC differentiation media at day 21. The cells are round in shape and form spherical dense clusters. Scale bars are a, b: 30 µm and c: 10 µm.
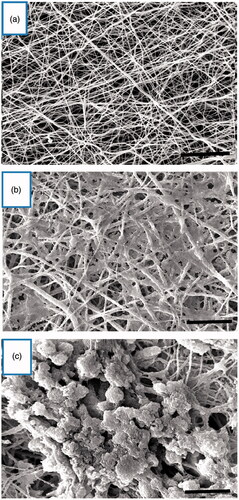
Figure 3. MTT cell proliferation assay of hiPSCs on PES nanofibrous scaffold and tissue culture polystyrene at days 1, 3, 5 and 7 of cell culture. *p < .05.
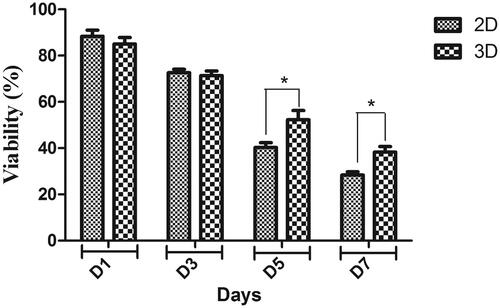
Figure 4. Relative expression of pancreatic-specific genes in end-stage derived-IPCs. Gene transcripts of the PES scaffold group are compared to the tissue culture plate group. Relative gene expressions were normalized to the human β2M as a reference gene. The value is shown in each graph as mean ± SD. *p < .05, **p < .01, ***p < .001 and ****p < .0001.
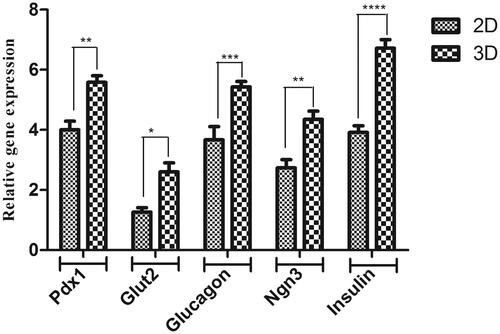
Figure 5. Immunocytochemical analysis of differentiated cells in end-stage derived-IPCs. Nuclei localization of Pdx1 and cytoplasmic localization of Insulin in differentiated IPCs at day 14 in the PES scaffold group (a) and tissue culture plate group (b) were detected by immunofluorescence analysis. Counter-staining of the nucleus (blue) was performed by DAPI and images were obtained by a fluorescence microscope. Scale bars are 100 µm.
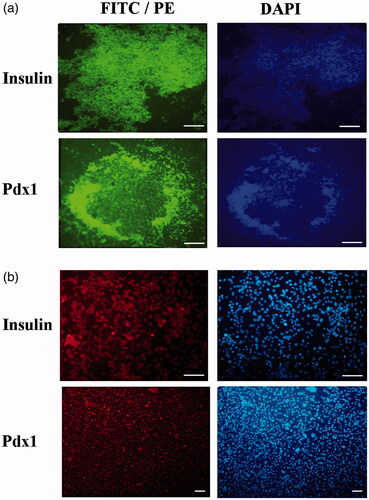
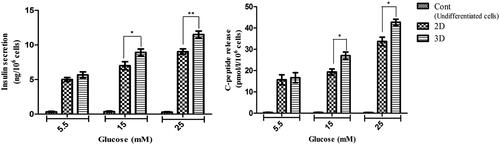
Figure 6. In vitro release of insulin and C-peptide in IPCs derived at day 21 of differentiation. (a and b) Insulin secretion and C-peptide release changes in two groups of IPCs and control group in response to various concentrations of glucose from 5.5 to 25 mM. Values are expressed as mean ± SD (n = 6). *p < .05.