Figures & data
Figure 1. (A) UV-Vis spectra of AGAunps using different molar ratio of HAuCl4: AG (a) 1:1, (b) 1:1.1, (c) 1:1.2, (d) 1:1.4, (e) 1:1.6, (f) 1:1.8. (B) UV-Vis spectra as a function of reaction time for the reaction of Au and AG at (a) 10 min, (b) 20 min, (c) 25 min, (d) 30 min, (e) 40 min and (f) 50 min.
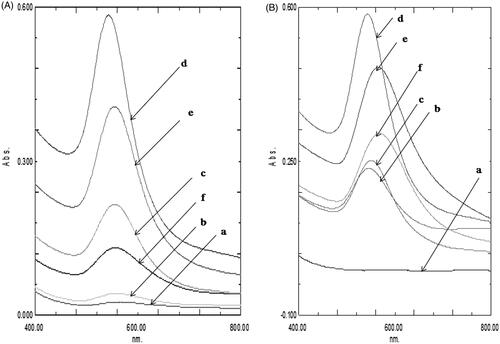
Figure 2. (A) Particle size, (B) Correlogram, (C) Zeta potential and (D) Phase plot of AGAunp.
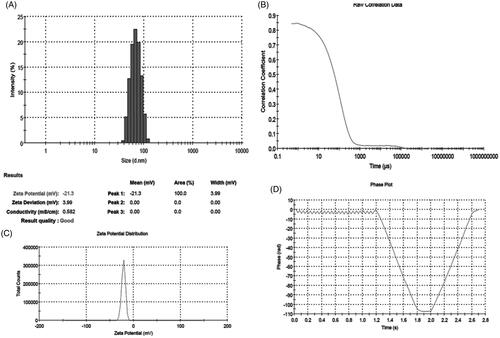
Figure 3. (A) TEM micrograph of AGAunp’s, (B) Histogram of AGAunp size distribution, (C) High resolution TEM micrograph of single AGAunp and (D) AGAunp SAED pattern.
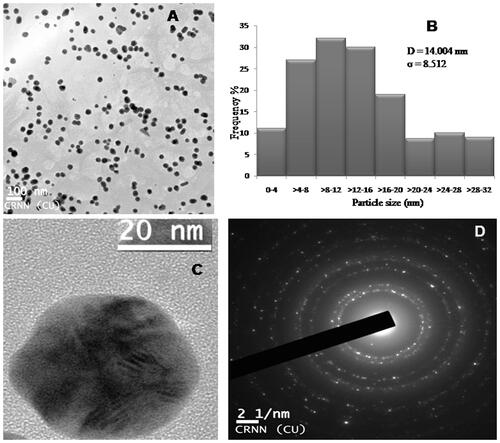
Figure 4. AGAunp EDAX spectrum.
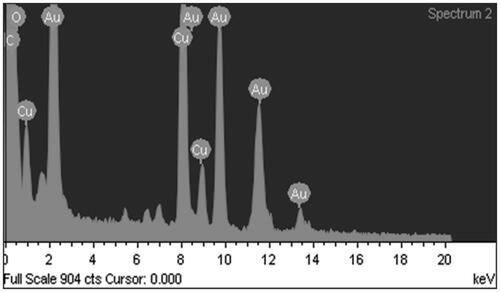
Figure 5. AGAunp AFM scan.
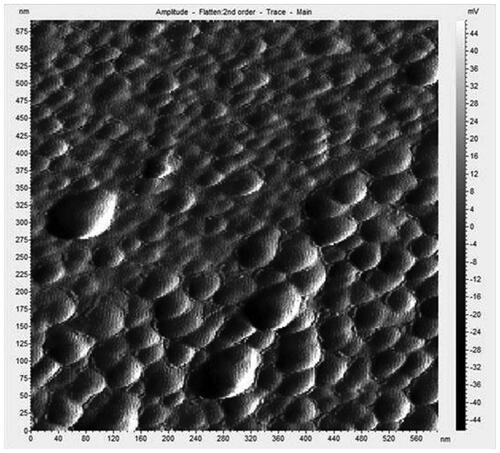
Figure 6. AGAunp XRD spectrum.
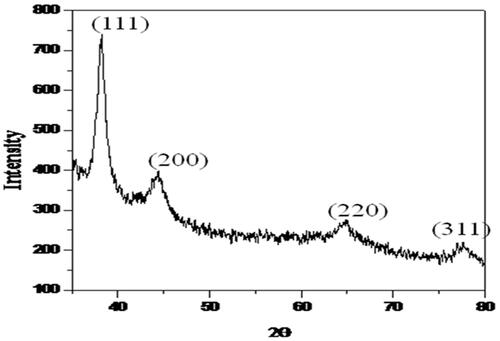
Figure 7. FTIR overlay of (A) AG and (B) AGAunp.
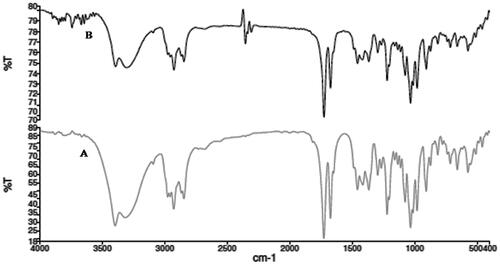
Figure 8. AG/AGAunp/Standard Antileishmanial drugs sensitivity profile against axenic amastigotes for Leishmania donovani and its drug resistant cell lines. WT (Wild Type), SSG (Sodium stibogluconate resistant) and PMM (paromomycin resistant) cell lines. IC50 (μM) values were determined as mean ± SD (n = 4). *p < .05 significant difference compared with SSG.
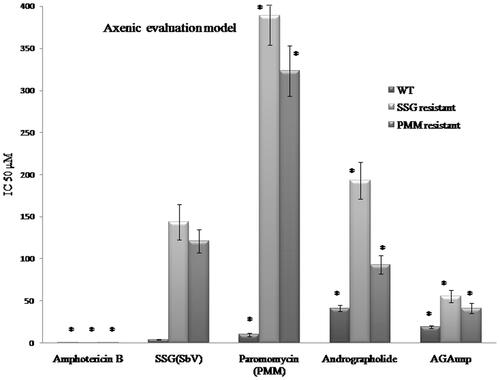
Figure 9. AG/AGAunp/Standard Antileishmanial drugs sensitivity profile against intracellular amastigotes for Leishmania donovani and its drug resistant cell lines. WT (Wild Type), SSG (Sodium stibogluconate resistant) and PMM (paromomycin resistant) cell lines. IC50 (μM) values were determined as mean ± SD (n = 4). *p < .05 significant difference compared with SSG. £p < .5 no significant difference compared with SSG.
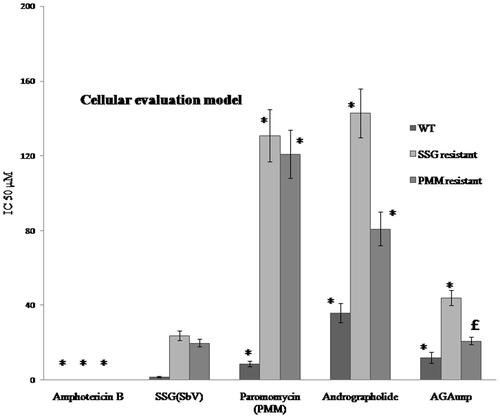
Table 1. Resistance index (RI), selectivity index (SI) and cytotoxicity of AG/AGAunp/Standard antileishmanial drugs against axenic and intracellular amastigotes for Leishmania donovani and its drug resistant cell linesTable Footnotea.
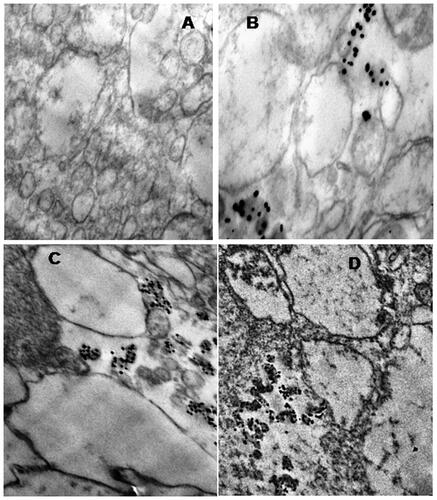
Figure 10. Macrophage uptake of AGAunp in TEM observed at different time intervals. (A) Macrophages with no AGAunp exposure, (B) after 15 min of AGAunp exposure, (C) after 1 h of AGAunp exposure, (D) after 2 h of AGAunp exposure.