Figures & data
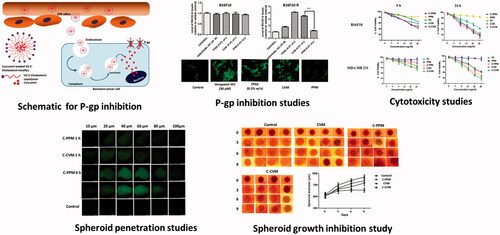
Figure 1. Synthesis scheme for the preparation of the cholesterol based amphiphilic polymer (CV).
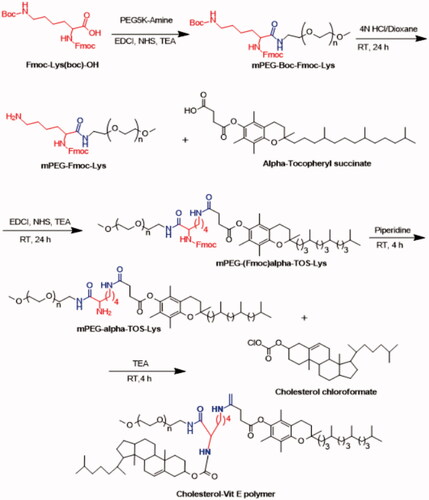
Figure 2. Characterization of final polymer using 1H NMR spectroscopy in (A) CDCl3 and (B) D2O.
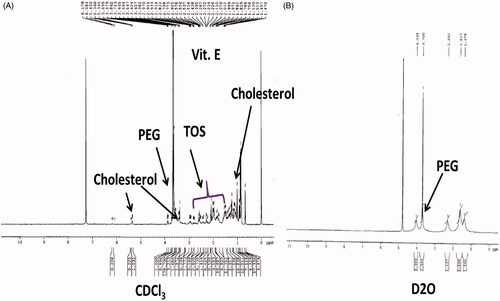
Figure 3. Characterization of micelles. (A) Particle size and zeta potential of CVM by DLS measurement. (B) Transmission electron microscopy of CVM. (C) Pyrene incorporation in CVM to assess critical micelles concentrations in reference to PPM. (D) In vitro release behaviour for free Cur and Cur-loaded PPM and CVM. (E) Hemolysis study for CV.
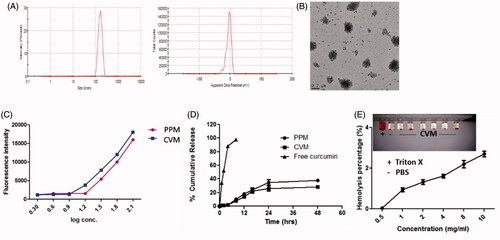
Table 1. Characterization of micelles.
Figure 4. Cellular uptake of Cur loaded in C-PPM and C-CVM. (A) Fluorescent images at 1 and 4 h; (B) Flow cytometer data of B16F10 cells treated with C-CVM and C-PPM at 50 and 100 μg/mL of curcumin for 1 and 4 h. For each panel in A, the images are in the order as follows: bright field, nuclei stained by using DAPI (blue), Cur fluorescence and overlay-images of both the fluorescence images. The geo mean fluorescence data are represented as mean ± SD, averaged from three separate experiments. Statistical significance in difference between the means was analyzed by Student’s t-test, ***p < .001 (For colour variation, please check online version).
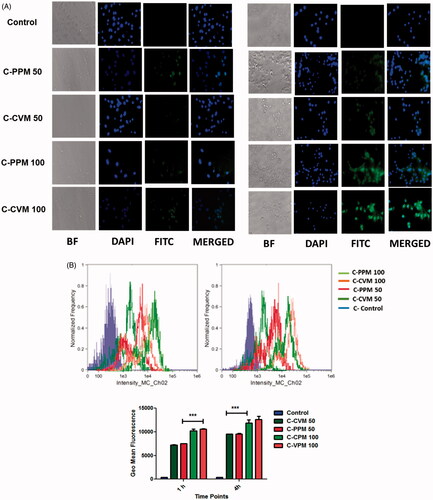
Figure 5. Cellular uptake of Cur loaded in C-PPM and C-CVM. (A) Fluorescent images at 1 and 4 h; (B) Flow cytometer data of MDA MB-231 cells treated with C-CVM and C-PPM at 50 and 100 μg/mL of curcumin for 1 and 4 h. For each panel in A, the images are in the order, that is, bright field, nuclei stained by using DAPI (blue), Cur fluorescence and overlay-images of both the fluorescence images. For Figure B, geo mean fluorescence data are mean ± SD, averaged from three separate experiments. Statistical significance in difference between the means was analyzed by Student’s t-test, ***p < .001.
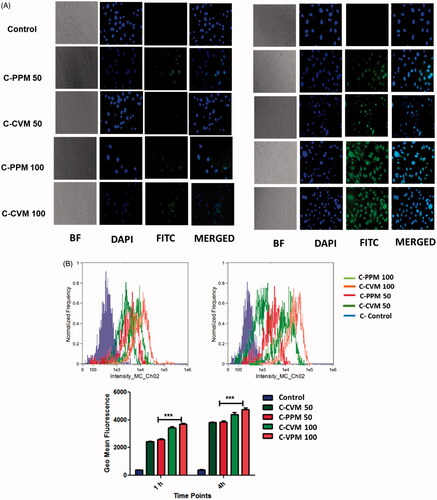
Figure 6. Assessment of P-gp inhibitory effect of CVM. (A) Quantitative estimation of the internalized Rh-123 fluorescence in B16F10 and B16F10-R cells treated with verapamil, TPGS, CVM and PPM. (B) Fluorescence micrograph of resistance cells received the same treatment regimen as A. Cells treated with only Rh-123 is considered as control. The results are expressed as mean ± S.D, n = 3.
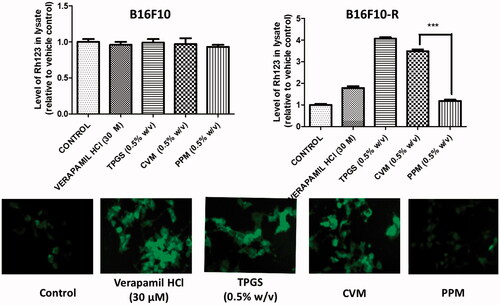
Figure 7. Cytotoxicity studies of (A) B16F10 and (B) MDA-MB-231 cells treated with CVM, Free Cur, C-CVM and C-PPM at Cur concentration of 0–50 μg/mL for 6 h followed by 24 h drug-free incubation and for 24 h. Statistical significance of difference was analyzed by Student’s t-test, ***, ** indicate p < .001 and .01, respectively.
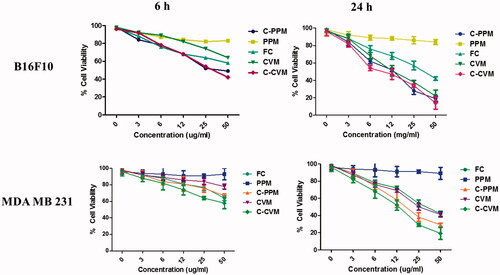
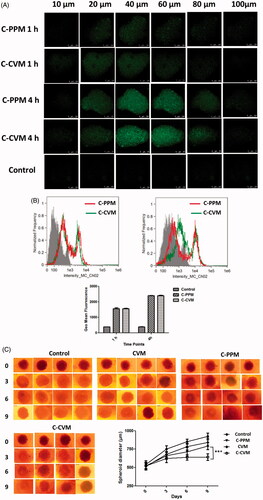
Figure 8. Assessment of the treatment efficacy in A549 spheroids. (A) Penetration of C-CVM and C-PPM through A549 spheroids. Spheroids were incubated for 1 h and 4 h at 37 °C with C-CVM or C-PPM at Cur concentration 25 µM. The distribution of curcumin was analyzed by visualizing the micrograph of cells taken as Z-stack images using confocal microscope. (B) Quantification of cellular uptake of Cur by spheroidal cells using flow cytometry. Geo mean fluorescence data are mean ± SD, averaged from three separate experiments. (C) Phase-contrast images of spheroids grown for different days following treatment with C-CVM and C-PPM at Cur concentration of 25 µM and empty CVM for 9 days, changes in diameter of spheroids subjected to different treatments. The significance of difference between the means was analyzed by Student’s t-test, ***p < .001. Scale bar represents 200 µm.