Figures & data
Figure 1. (A) TEM image of CdNPs (right) and negatively stained CdNPs@BSA (left). (B) Schematic representation for synthesis of CdNPs@BSA. (C) Particle-size distribution histogram of CdNPs, mean diameter = 2 nm (P.D.I = 0.44) and (D) Schematic representation for synthesis of CdNPs@BSA. (E) Particle-size distribution histogram of free BSA, mean diameter = 7.5 nm (P.D.I = 0.38).
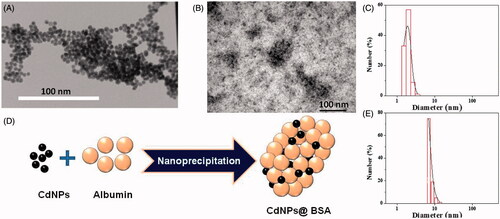
Figure 2. DLS plot of CdNPs@BSA, (A) First-order electric field correlation functions versus time at the indicated scattering angles. Inset plot: τ−1 as a function of q2. (B) First-order electric field correlation functions versus q2t at the indicated scattering angles. The inset plot shows random distribution and small values of the residuals. (C) First-order electric field correlation functions and their corresponding fits at 90°.
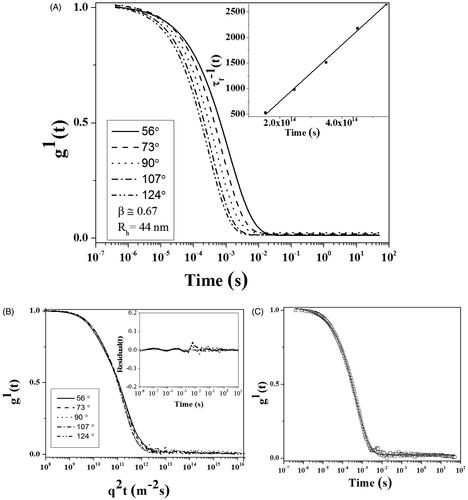
Figure 3. (A) UV–Vis spectra of CdNPs (▲▲▲▲), CdNPs@BSA (______) and BSA (- - -). (B) Emission fluorescence spectra of CdNPs@BSA (______), NAs (….), BSA (- - -). Far CD-UV (C) and near CD-UV (D) spectra of CdNPs@BSA (______), NAs (….) and BSA (- - -). Insert table: Secondary structural changes of BSA, NAs and CdNPs@BSA.
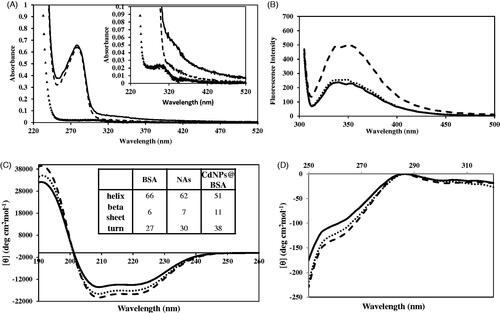
Figure 4. Cell viability of (A) MDA-MB 231, (B) WBC, (C) MCF-10A treated with CdNPs ▪ and CdNPs@BSA □. (D) Comparing cell viability of different kinds of cells treated with CdNPs and CdNPs@BSA.
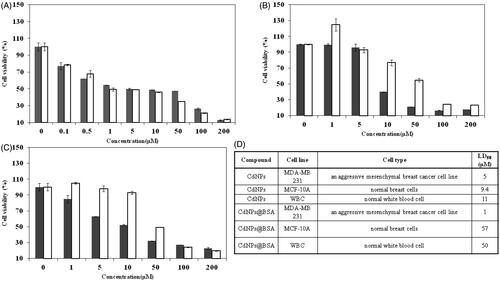
Figure 5. (UP) Inverted microscopic images of MDA-MB-231 Cells. (A) control, (B) and (C) treated with LD50 concentrations of CdNPs and CdNPs@BSA for 24 h, respectively. Middle) Fluorescent microscopy of cells stained with acridine orange/ethidium bromide. (D) control, (E) and (F) treated with CdNPs and CdNPs@BSA, respectively. (Down) DNA ladder on agarose gel electrophoresis. MDA-MB-231 Cells were treated with LD50 concentrations of CdNPs and CdNPs@BSA for 24 h and DNA fragmentation was analyzed. Lane M: 1 kB ladder, lane 1: control, lane 2: CdNPs, lane 3: CdNPs@BSA.
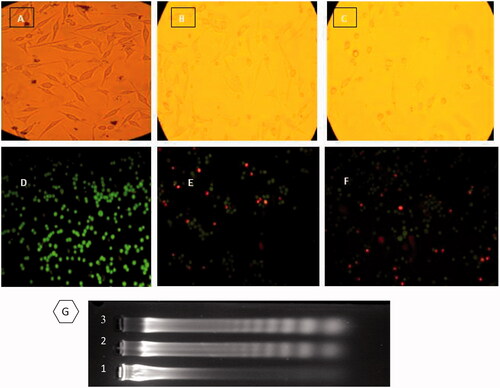
Figure 6. (A–C) Two-dimensional contour density plots of MDA-MB-231 cells obtained by flow cytometry based assays. A: Control, B-C: Treated cells with CdNPs and CdNPs@BSA, respectively. Cell necrosis and apoptosis were measured by using 7-AAD and Annexin-V dyes. (D–F) Flow cytometry based assay of cell cycle. D: Control, E–F: Treated cells with CdNPs and CdNPs@BSA, respectively.
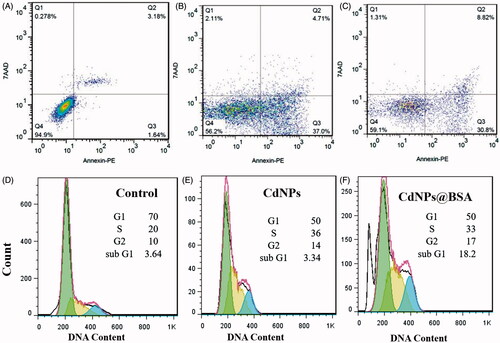
Table 1. Quantified flow cytometry analysis of PE annexin V and 7-AAD stained MDA-MB-231 cells after 24 h treatment with CdNPs and CdNPs@BSA.
Figure 7. Two-dimensional contour density plots of WBCs cells obtained by flow cytometry-based assays. (A) Control, (B) Treated cells with CdNPs@BSA. Cell necrosis and apoptosis were measured by using 7-AAD and Annexin-V dyes.
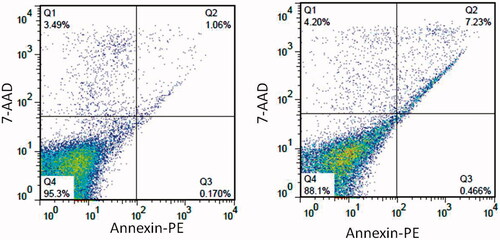
Table 2. Quantified flow cytometric analysis of PE annexin V and 7-AAD stained WBCs cells after 24 h treatment with CdNPs@BSA.
Figure 8. TEM images of internalization of CdNPs@BSA across the cell membrane, (A) lysosome of untreated cell, (B) nucleus of untreated cell, (C) lysosome of treated cells and (D) cytoplasm of treated cell.
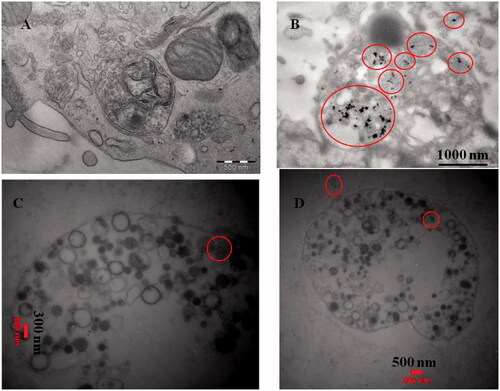
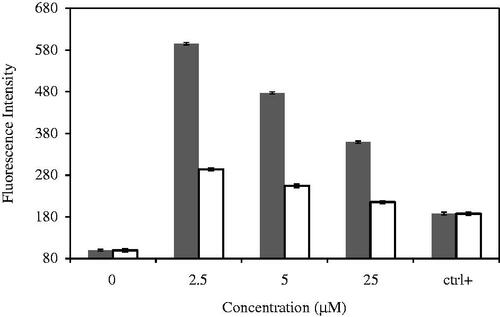
Figure 9. ROS generation in MDA-MB-231 cells treated with CdNPs ▪ and CdNPs@BSA □. Relative fluorescence of DCF was measured by excitation at 485 and emission at 530 nm.