Figures & data
Table 1. RT-PCR primers.
Figure 1. Morphology of cells after 3 and 7 days treatment of RAs. (a,e) SH-SY5Y cells, treated with DMSO for 3 and 7 day, respectively as control group, maintained the original undifferentiated state. (b–d) Morphology of cells treated with 9-cis-RA, 13-cis-RA and at-RA, respectively for 3 days shows neurite outgrowth. (f–h) Morphology of cells treated with 9-cis-RA, 13-cis-RA and at-RA, respectively all shows longer neurite outgrowth than 3 days. (i,j) Differentiation rate of 3 and 7 days, respectively. Differentiation rate was calculated as the average of five fields of each group randomly.
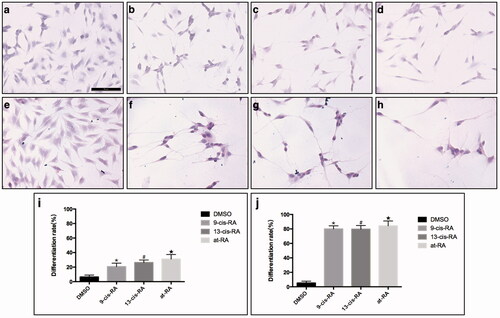
Figure 2. Expression of neural differentiation markers Nestin and β-III Tubulin changed during RAs-induced differentiation of SH-SY5Y cells. (a) SH-SY5Y cells were cultured in culture medium with no treatment as control group. (b) SH-SY5Y cells were treated with equal volume DMSO for 3 days as control. (c–e) SH-SY5Y cells treated with 9-cis-RA, 13-cis-RA and at-RA, respectively for 3 days showed increase trend in the protein level of β-III Tubulin and a decline trend of Nestin. (f) SH-SY5Y cells were treated with equal volume DMSO for 7 days as control. (g–i) SH-SY5Y cells treated with 9-cis-RA, 13-cis-RA and at-RA, respectively for 7 days showed a significant increase in β-III Tubulin and almost none Nestin. The exposure time of β-III Tubulin, Nestin and DAPI were 174 ms, 1.1 s and 31 ms, respectively.
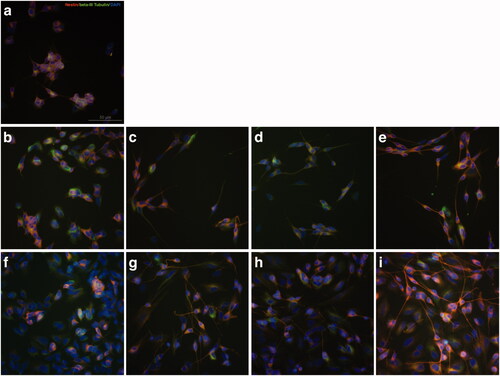
Figure 3. Relative protein expression of neural differentiation markers Nestin and β-III Tubulin measured by Western blot. Relative protein expression of neural Nestin and β-III Tubulin after 3 days treatment of DMSO, 9-cis-RA, 13-cis-RA and at-RA were detected by Western blot respectively, and the relative expression level was calculated using gray value analysis. Treatment group of 9-cis-RA, 13-cis-RA and at-RA was upon normalization to the DMSO-treated control group.
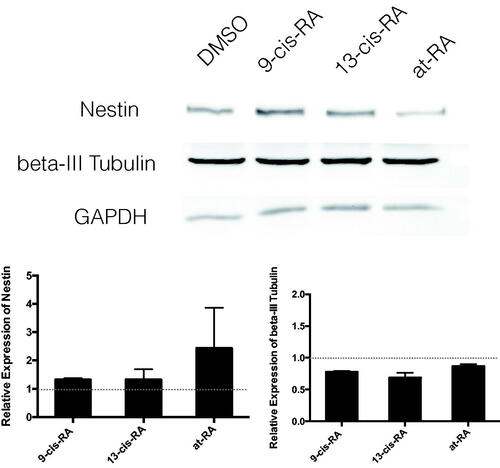
Figure 4. Relative mRNA expression of neural differentiation markers Nestin and β-III Tubulin measured by real-time PCR. Treatment group of 9-cis-RA, 13-cis-RA and at-RA was upon normalization to the DMSO-treated control group.
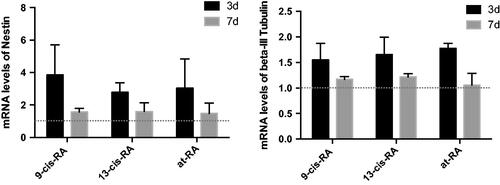
Figure 5. Ultrastructural images of SH-SY5Y cells treated with RAs. (a) Ultrastructural images of SH-SY5Y cells treated with DMSO for 7 days shows smooth edge, possessing larger nucleoli with regular shape. (b–d) Ultrastructural images of SH-SY5Y cells treated with 9-cis-RA, 13-cis-RA and at-RA, respectively for 7 days shows that the morphology of cells and nuclei are irregular, the nuclear–cytoplasmic ratios are decreased, and microvillus appear at the edge of cell membrane. (e) Average number of mitochondria of SH-SY5Y cells treated with DMSO, 9-cis-RA, 13-cis-RA and at-RA, respectively for 7 days. Five fields were selected for each group, each field containing at least one complete cell.
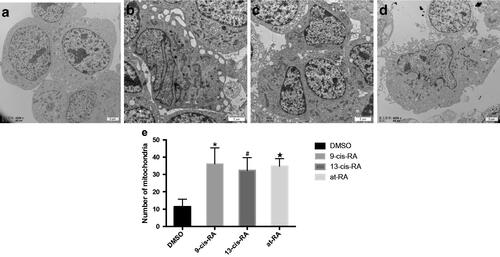
Figure 6. Ultrastructural images of mitochondria and the expression of PGC-1a during RAs-induced neural differentiation of SH-SY5Y cells. (a) SH-SY5Y cells treated with DMSO for 7 days shows dotted or spherical mitochondria with immature cristae. (b–d) SH-SY5Y cells treated with 9-cis-RA, 13-cis-RA and at-RA, respectively for 7 days shows increased and long strip-shaped mitochondria with well-developed mitochondria cristae. (e–h) Expression of PGC-1a on SH-SY5Y cells treated with DMSO, 9-cis-RA, 13-cis-RA and at-RA, respectively for 7 days.
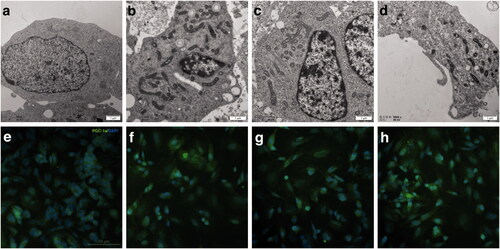
Figure 7. The mRNA expression of PGC-1a and NEMGs treated with RAs for 3 days. The mRNA level were measured by real-time PCR, GAPDH was measured as a loading control. The relative expression level of PGC-1a and NEMGs after 3 days treatment of 9-cis-RA, 13-cis-RA and at-RA were calculated respectively by means of the △△CT method, upon normalization to the DMSO-treated control group. Data were expressed as the mean ± SEM.
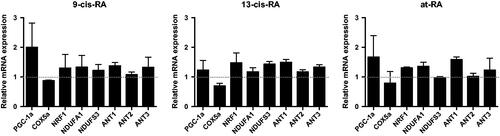
Figure 8. The mRNA and protein expression of RIP140 and PGC-1a treated with RAs. The mRNA level were measured by real-time PCR, GAPDH was measured as a loading control. The relative expression level of RIP140 and PGC-1a after 3 and 7 days treatment of 9-cis-RA, 13-cis-RA and at-RA were calculated respectively by means of the △△CT method, upon normalization to the DMSO-treated control group. Data were expressed as the mean ± SEM. Relative protein expression of RIP140 and PGC-1a after 3 days treatment of DMSO, 9-cis-RA, 13-cis-RA and at-RA were detected by Western blot, respectively, and the relative expression level was calculated using gray value analysis. Treatment group of 9-cis-RA, 13-cis-RA and at-RA was upon normalization to the DMSO-treated control group.
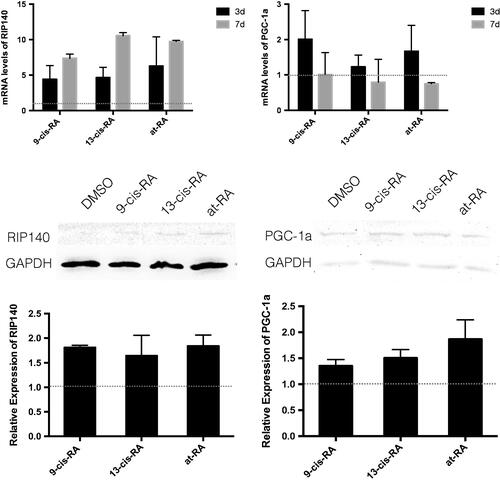
Figure 9. The mRNA and protein expression of RARα, RARβ and RARγ treated with RAs. The mRNA level were measured by real-time PCR, GAPDH was measured as a loading control. The relative expression level of RARα, RARβ and RARγ after 3 and 7 days treatment of 9-cis-RA, 13-cis-RA and at-RA were calculated respectively by means of the △△CT method, upon normalization to the DMSO-treated control group. Data were expressed as the mean ± SEM. Relative protein expression of RARα, RARβ and RARγ after 3 days treatment of DMSO, 9-cis-RA, 13-cis-RA and at-RA were detected by Western blot, respectively, and the relative expression level was calculated using gray value analysis. Treatment group of 9-cis-RA, 13-cis-RA and at-RA was upon normalization to the DMSO-treated control group.
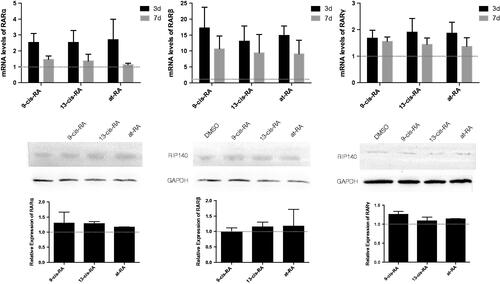
Figure 10. Morphology of cells treated with RAs for 3 days. Cells treated with RARα antagonist BMS (a–d) and RARβ antagonist LE135 (e–h) and control group without antagonist (i–l). Treatment with RAs was as follows: DMSO group (a,e,i), 9-cis-RA group (b,f,j), 13-cis-RA group (c,g,k) and at-RA group (d,h,l). (m) Differentiation rates were calculated as the average of five random fields of each group. Differentiation rates for BMS and LE treatment were decreased significantly in contrast with the no antagonist control group (p < .05). (n,o) The mRNA levels of the two neural markers Nestin and β-III Tubulin were both down-regulated in the BMS and LE groups.
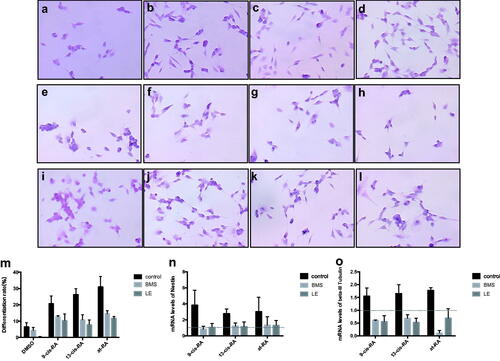
Figure 11. Proliferation rate of cells treated with RARα and RARβ antagonist. It had been proven that RARα and RARβ antagonist BMS and LE135 have no effect on the OD value. Cells were treated with BMS and LE135 for 0, 24, 48 and 72 h, and then proliferation rate were detected using CCK8 test. The control group were maintained in the normal culture medium.
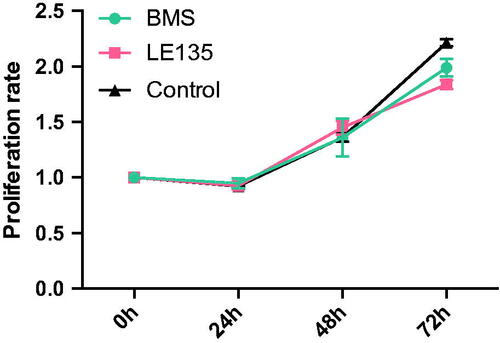
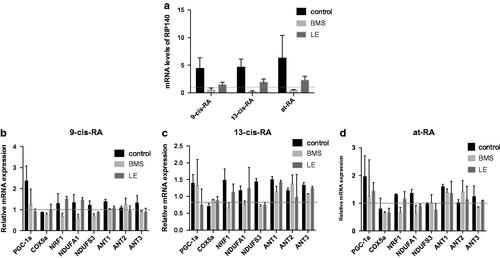
Figure 12. The effect of antagonists on the mRNA expression of RIP140, PGC-1α and NEMGs during RAs-induced differentiation. (a) The mRNA expression of RA target gene RIP140 treated with RAs for 3 days. The expression of RIP140 was up-regulated in the no antagonist control group and down-regulated in both BMS- and LE-treated groups. (b–d) The mRNA expression of PGC-1α and NEMGs in cells treated with RAs for 3 days. The expression of PGC-1α and NEMGs was mostly up-regulated in the no antagonist control group and down-regulated in both BMS- and LE-treated groups.