Figures & data

Figure 1. (A) UV-Vis absorption spectrum of the generated POA-Au NPs. (Inset) Photograph of the generated POA-Au NPs. (B) TEM image of the as-prepared POA-Au NPs. Scale bar: 50 nm.
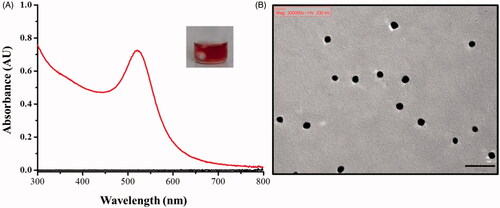
Figure 2. Examination of cell biocompatibility of POA-Au NPs toward L929 cells. L929 cells (∼4 × 10⁴ cells mL−1, 100 μL) prepared in DMEM medium were treated with POA-Au NPs (100 μL) with different concentrations (0, 62.5, 125, 250, 500 and 1000 µgmL−1) that were prepared in DMEM medium, for (A) 1 h (B) 2 h (C) 4 h and (D) 6 h, respectively. Blank stands for the control sample that was not treated with POA-Au NPs. Three replicates were conducted for obtaining the bar graphs.
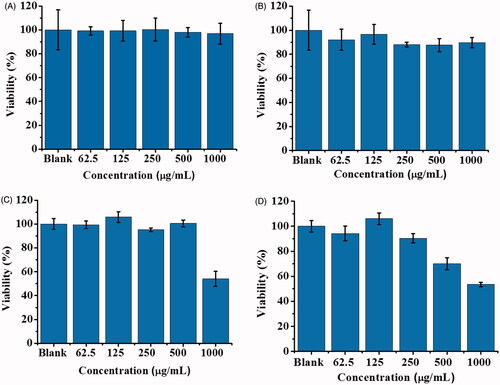
Figure 3. Examination of the cell biocompatibility of POA-Au NPs toward Hep G2 cells. Hep G2 cells (∼4 × 10⁴ cells mL−1, 100 μL) prepared in MEM medium were treated with POA-Au NPs (100 μL) with different concentrations (0, 62.5, 125, 250, 500 and 1000 µgmL−1) that were prepared in MEM medium, for (A) 1 h (B) 2 h (C) 4 h and (D) 6 h, respectively. Blank stands for the control sample that was not treated with POA-Au NPs. Three replicates were conducted.
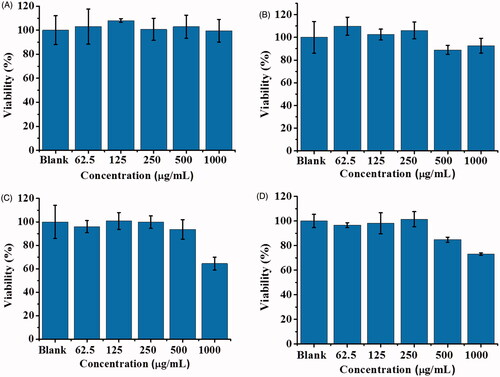
Figure 4. Dark field optical images of L929 cells (1 ml, ∼106 cells/well) obtained after the treatment with POA-Au NPs at the concentations of (A) 0, (B) 62.5, (C) 125, (D) 250, (E) 500 and (F) 1000 µgmL−1 for 6 h, respectively. Exposure time was set to 40 ms. The scale bar is 10 µm.
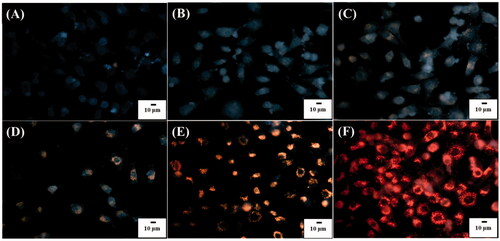
Figure 5. Overlapped images of L929 cell (1 ml, ∼106 cells mL−1) obtained after incubated with POA-Au NPs at the concentrations of (A) 0, (B) 62.5, (C) 125, (D) 250, (E) 500 and (F) 1000 µgmL−1 for 6 h, from dark field and fluorescence microscopy. The cells were stained by Hoechst 33342. The excitation wavelength was set at 330–380 nm and the exposure time was set to 20 ms. The scale bar is 10 µm.
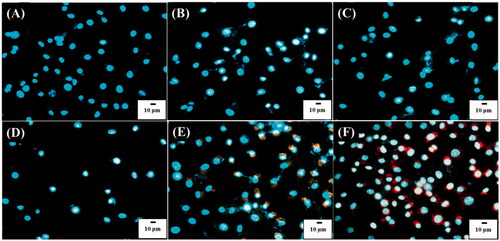
Figure 6. Optical images of Hep G2 cells (1 ml, 106 cells mL−1) under dark field obtained after treated with POA-Au NPs with the concentations of (A) 0, (B) 62.5, (C) 125, (D) 250, (E) 500 and (F) 1000 µgmL−1 for 6 h. Exposure time was set to 40 ms. The scale bar is 10 µm.
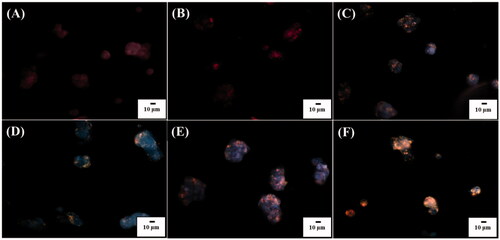
Figure 7. Overappled images of Hep G2 cells (106 cells mL−1, 1 ml) obtained after being incubated with POA-Au NPs at the concentations of (A) 0, (B) 62.5, (C) 125, (D) 250, (E) 500 and (F) 1000 µgmL−1 for 6 h, respectively obtained from dark field and fluorescence microscopy. The cells were stained by Hoechst 33342. The excitation wavelength was set at 330–380 nm and the exposure time was set to 10 ms.
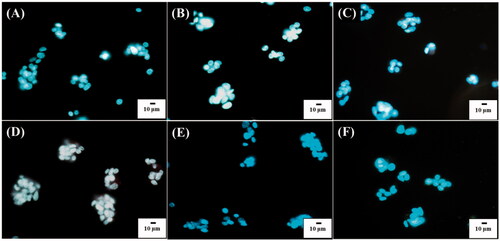
Figure 8. MALDI mass spectra of the cell lysate derived from E. coli O157:H7 obtained (A) in a low mass region and (B) in a high mass region. The molecular weight of SLT-1B is 9743 Da, while that of SLT-1 A is ∼35 kDa.
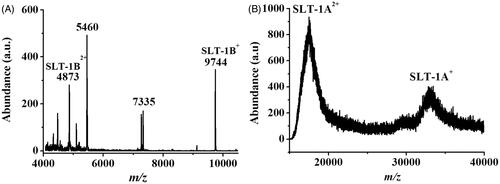
Figure 9. Examination of the cell viability of the cells infected by SLT-1-containing cell lysate derived from E. coli O157:H7 (OD600 = ∼1), which was estimated to have SLT-1 with the concentration of ∼11.1 nM. Thus, 2.8-fold diluted cell lysate contained ∼3.96 nM of SLT-1. (A) L929 cells cultured in DMEM medium (∼4 × 10⁴ cells mL−1, 100 μL) were incubated with the cell lysates (100 μL), which were diluted with different factors, for 1 h. The cell lysate was diluted by DMEM medium. (B) Hep G2 cells cultured in MEM medium (∼4 × 10⁴ cells mL−1, 100 μL) were incubated with the cell lysates (100 μL), which were diluted with different factors, for 1 h. The cell lysate was diluted by MEM medium. Blank stands for the control sample that was not treated with SLT-1 containing cell lysate. Three replicates were conducted.
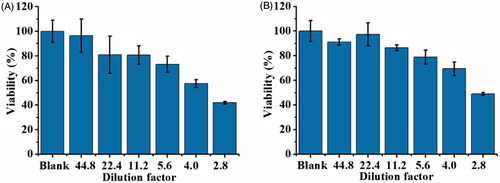
Figure 10. Examination of the protective roles of POA-Au NPs toward L929 cells and Hep G2 cells. Bar graphs representing the cell viability obtained from (A) L929 cells (100 μL, ∼4 × 10⁴ cells mL−1) and (B) Hep G2 cells (100 μL, ∼4 × 10⁴ cells mL−1) that were treated by the cell lysate containing the conjugate of SLT-1B and POA-Au NPs with different concentrations (0–1000 μgmL−1) for 2 h. Three replicates were conducted for the sample at each concentration. Blank stands for the control sample that was not treated with the cell lysate and POA-Au NPs.
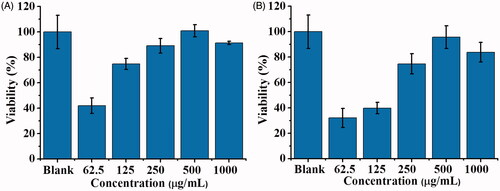
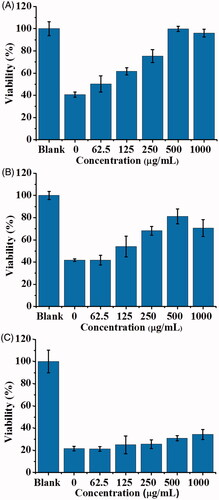
Figure 11. Examination of the protective roles of POA-Au NPs toward SLT-1-infected L929 cells. Bar graphs obtained from L929 cells (100 μL, ∼4 × 10⁴ cells mL−1) that were infected by the SLT-containing cell lysate derived from E. coli O157:H7 for (A) 1 h, (B) 2 h and (C) 4 h followed by treated with POA-Au NPs at different concentrations (0, 62.5, 125, 250, 500 and 1000 µgmL−1) for 2 h, respectively. Blank stands for the control sample that was not treated with the cell lysate and POA-Au NPs. Three replicates were conducted for each concentration.
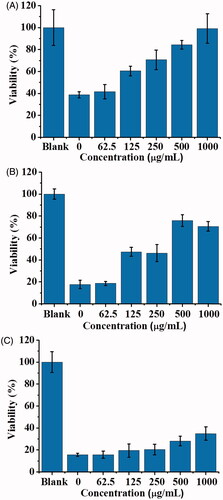
Figure 12. Examination of the protective roles of POA-Au NPs toward SLT-1-infected Hep G2 cells. Bar graphs obtained from Hep G2 cells (100 μL, ∼4 × 10⁴ cells mL−1) that were infected by the SLT-containing cell lysate derived from E. coli O157:H7 for (A) 1 h, (B) 2 h and (C) 4 h followed by treated with POA-Au NPs at different concentrations (0, 62.5, 125, 250, 500, and 1000 µgmL−1) for 2 h, respectively. Blank stands for the control sample that was not treated with the cell lysate and POA-Au NPs. Three replicates were conducted for each concentration.