Figures & data
Figure 1. Inhibitory effects of various concentrations of 5-FU on HCT-8 and HCT-8/FU cells. Cell viability, as assessed by the CCK-8 assay, was determined 24 h after the exposure of HCT-8 and HCT-8/FU cells to increasing concentrations of 5-FU. Results represent the average of triplicate wells and are representative of three independent experiments.
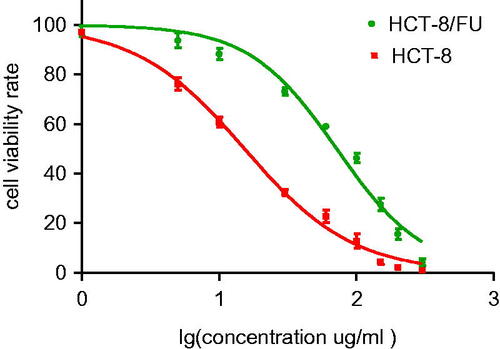
Figure 2. Methylation level of NME2 analysed using a methylation chip and confirmed by pyrosequencing. A pyrosequencing analysis was performed for NME2, which exhibited differential methylation between HCT-8 and HCT-8/FU.
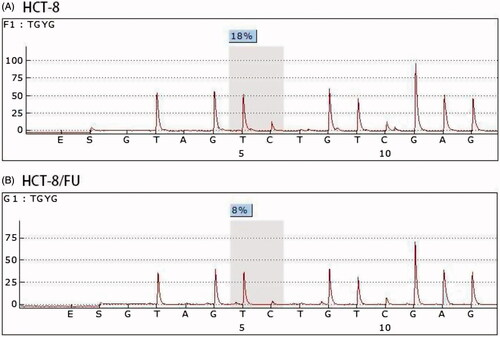
Figure 3. NME2 expression level was elevated in HCT-8/FU cells. (A) qRT-PCR analysis was performed for NME2, which was differentially expressed between HCT-8 and HCT-8/FU cells. The expression level of NME2 was normalized to the level in HCT-8 cells. (B) Western Blotting analysis was performed for NME2, Western Blotting results were consistent with qRT-PCR, showed that the NME2 protein level was also significantly upregulated in HCT-8/FU cells compared with the HCT-8 cells. Statistical analyses were carried out using t-test, *p < .05.
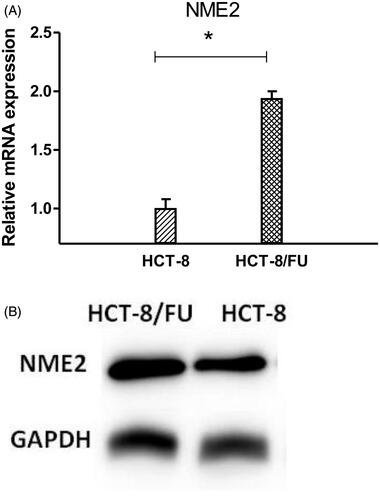
Figure 4. Effect of NME2 knockdown on cell survival. HCT-8/FU cells transfected with SiRNA targeting NME2 and untransfected cells (C) were cultured for 24 h. (A) Relative levels of NME2 mRNA were analysed by qRT-PCR in HCT-8/FU cells after different siRNA treatments. (B) Protein level of NME2 was analysed by Western Blotting in HCT-8/FU cells after different SiRNA treatments. (C) Inhibitory effects of various concentrations of 5-FU on HCT-8/FU cells by SiR1 treatments. (D–G) NME2 was silenced in HCT-116 and LOVO cells. (D,F) Relative levels of NME2 mRNA by qRT-PCR in HCT-116 and LOVO cells after different SiRNA treatments; (E,G) Inhibitory effects of various concentrations of 5-FU on HCT-116 and LOVO cells by SiR1 treatments. *p < .05, **p < .01, ns represents no statistic difference.
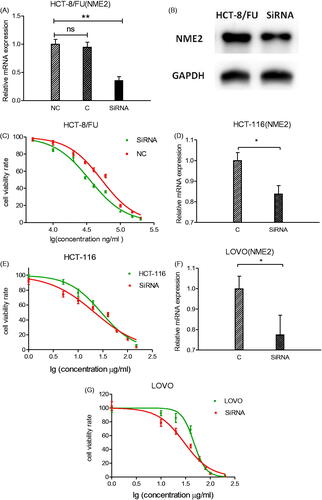
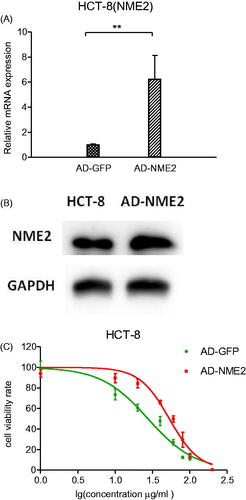
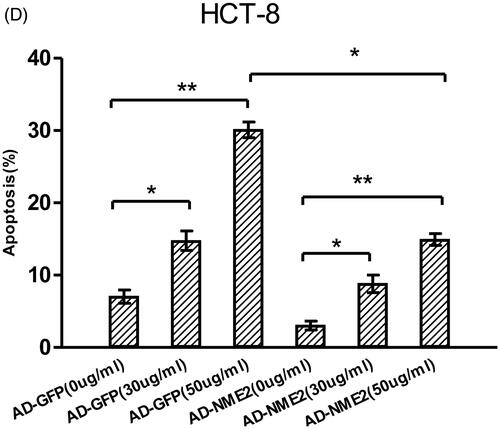
Figure 5. Effect of NME2 overexpression on cell survival. HCT-8 cell line with NME2 overexpression and with stable GFP overexpression served as a control. (A) Relative levels of NME2 mRNA were analysed by qRT-PCR in HCT-8 cells after different treatments. (B) Protein level of NME2 was analysed by Western Blotting in HCT-8 cells after different treatments. (C) Inhibitory effects of various concentrations of 5-FU on HCT-8 cells by different treatments. **p < .01.