
Figures & data
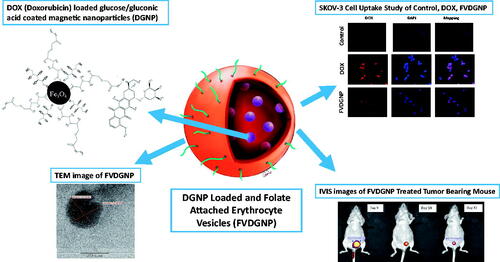
Figure 1. Schematized reaction of formation DGNP and illustrated structure of DGNP-loaded and folate-attached erythrocyte vesicles.
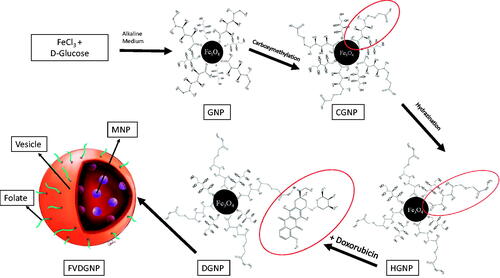
Figure 2. Characterization of GNP: (A) Raman spectroscopy, (B) XPS, (C) VSM, (D) TG and (E) SEM analyses.
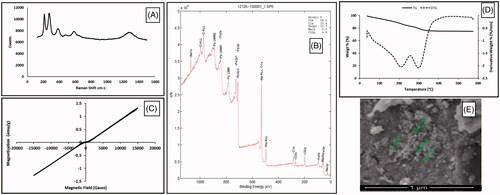
Figure 3. (A) XPS analysis of CGNP and (B) FTIR spectra of GNP, CGNP, HGNP and DGNP.
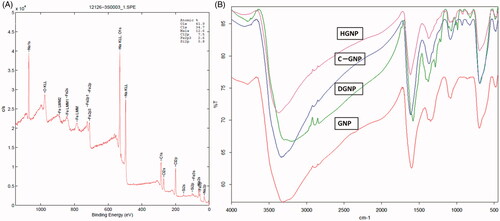
Figure 4. (A) Effect of DOX concentration on binding amount and efficiency to GNP. Characterization of DGNP: (B) VSM, (C) TEM and (D) TG analyses.
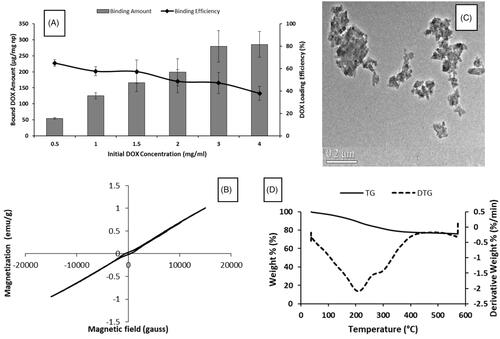
Figure 5. (A) EF-TEM image of FVDGNP. (B) In vitro drug release of nanocarrier. (C) In vivo biodistribution (%) profile of FVDGNP.
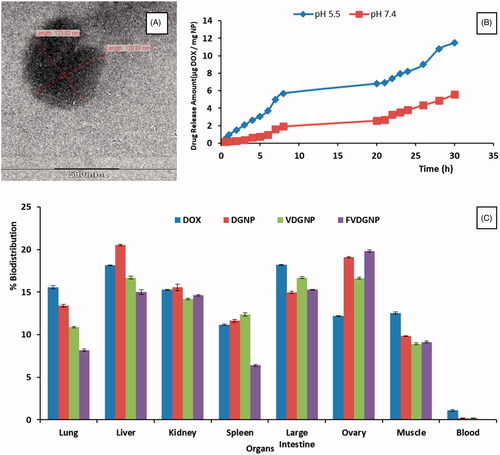
Table 1. Serum protein-binding yield of nanocarriers with varying ratios of serum:nanocarrier suspension.
Figure 6. Death (%) of cells treated with drug groups: for SKOV3 cells at (A) 24, (B) 48, (C) 72 h, for A2780 cells at (D) 24, (E) 48, (F) 72 h and for OVCAR3 cells at (G) 24, (H) 48, (I) 72 h.
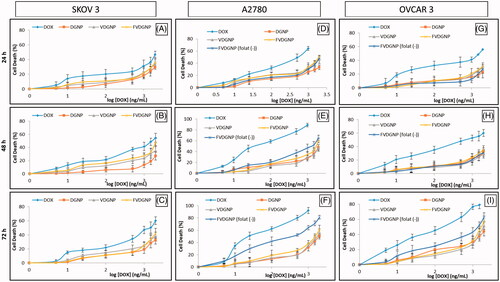
Table 2. IC50 values (µg/mL) of DOX and DOX-loaded nano vehicles for SKOV3, A2780 and OVCAR3 cell lines at 72 h.
Figure 7. Fluorescent microscope images of FVDGNP, DOX and control group in SKOV3, A2780 and OVCAR3 cell line with different filters.

Figure 8. IVIS Spectrum images of biodistribution of (A1) DOX, (A2) DGNP, (A3) VDGNP and (A4) FVDGNP in mice at 3 h. Representative ex vivo images of liver, lung, spleen, kidney, ovary, large intestine and muscle (top to down) 3 h after injection of (B1) DOX, (B2) DGNP, (B3) VDGNP and (B4) FVDGNP.
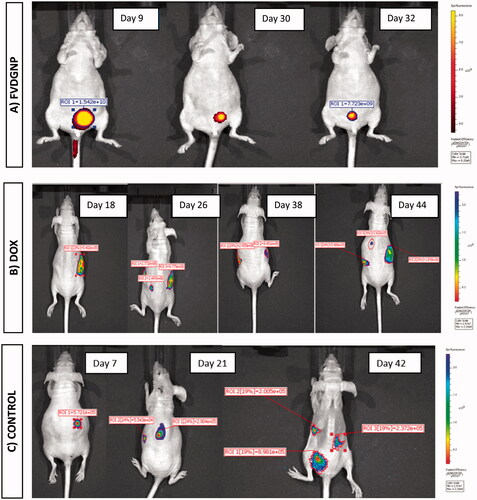
Figure 9. IVIS Spectrum tumor images of mice intravenously treated with (A) FVDGNP (visualized with 2DG-750 probe), (B) DOX and (C) PBS (both visualized with luciferin solution).
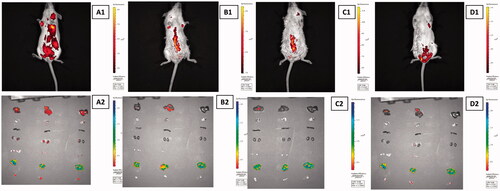
Table 3. Data indicates the survival and imaging period of nude mice in all treatment groups.
Table 4. Blood biochemistry profiles of healthy and PBS, DOX and FVDGNP-treated mice groups.