Figures & data

Table 1. Parameters for cryogel membrane synthesis.
Figure 1. (A) The structure of MAH monomer. (B) The UV-spectrum of MAH–Cu(II)–MMC complex. (C) Hypothetical model for the MAH–Cu(II)–MMC complex.
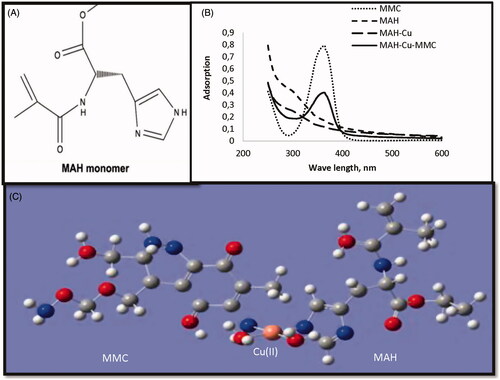
Figure 2. FTIR-ATR spectra of MMC-ICM and PHEMACM.
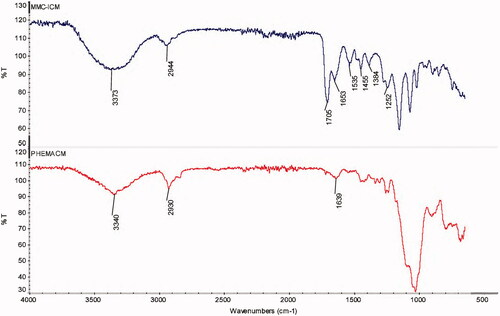
Figure 3. The SEM images of MMC-ICMs synthesized at (A) − 14 °C, (B) − 18 °C, (C) − 20 °C and (D) − 22 °C.
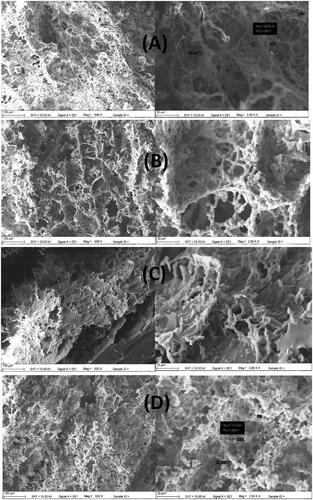
Figure 4. The SEM photograph of MMC-ICMs synthesized with different monomer ratios at −14 °C: (A) 1:16, (B) 1:10, (C) 1:8 and (D) 1:4 nHEMA/nMBAAm.
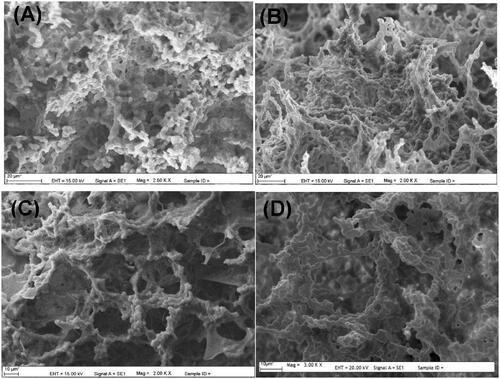
Table 2. Comparison of the properties of cryogel membranes.
Figure 5. Effect of cross-linker ratio on the MMC release (BPS buffer, 37 °C, n = 3).
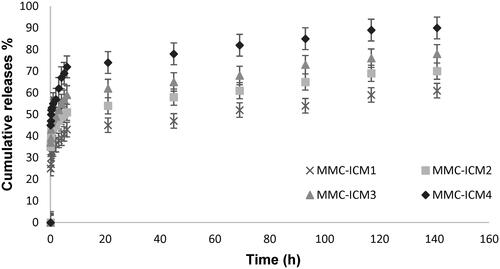
Figure 6. Effect of loaded drug concentration on the MMC release from MMC-ICM4.
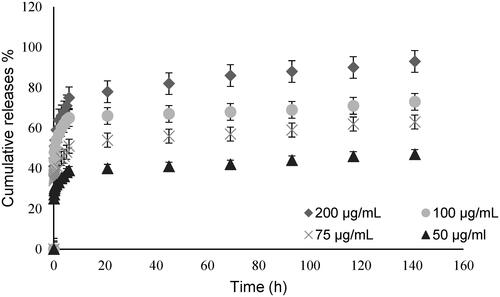
Figure 7. Effect of polymerization temperature on MMC delivery from the cryogel membranes.
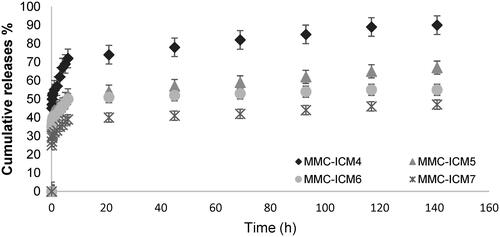
Table 3. Release kinetics data for MMC-ICMs.
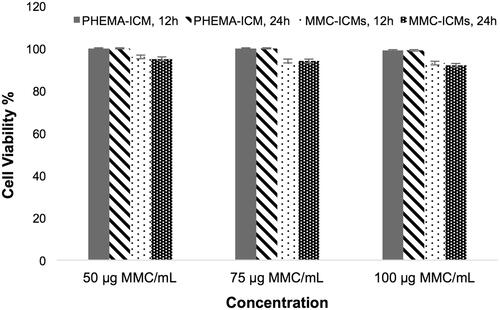
Figure 8. The viability of cell lines treated with MMC-ICMs and PHEMA-ICM (50, 75 and 100 μg MMC/mL) after 12 and 24 h.