Figures & data
Figure 1. Image of the extracted plasmid DNA visualized on an agarose gel (A) and UV–VIS spectra of the formed AgNPs under different conditions (B).
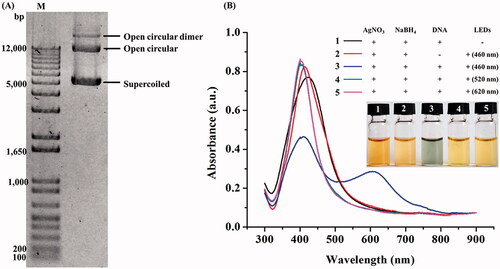
Figure 2. UV–VIS spectra of the synthesized AgNPs in the reactions containing different DNA contents at 24 h (A) and 20 µg DNA in a time course of 24 h (B) under the blue light irradiation.
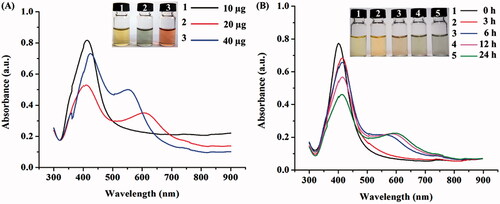
Figure 3. Representative TEM images of the synthesized yellow (A), green (B) and orange (C) colloidal AgNPs.
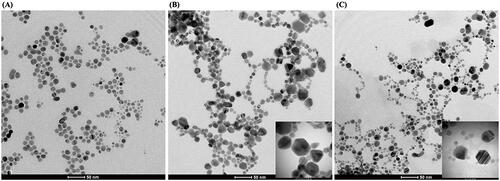
Figure 4. SEAD-TEM (A–C) and HR-TEM (D–F) analyses of the yellow, green and orange colloidal AgNPs.
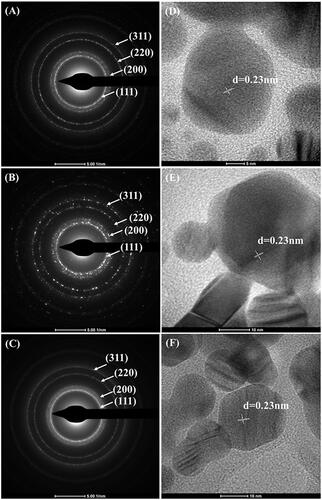
Figure 5. XRD pattern of the yellow (A), green (B) and orange (C) colloidal AgNPs.
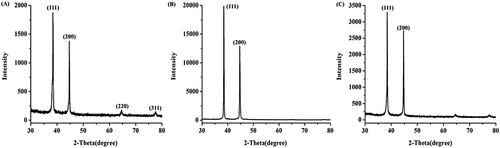
Figure 6. DPPH free radical scavenging activity of the synthesized AgNPs and positive control, ascorbic acid. The average data were calculated from five repetitive samples.
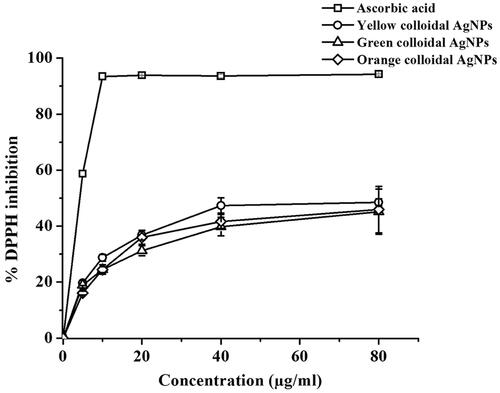
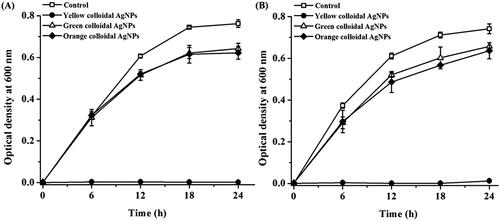
Figure 7. Growth curves of Escherichia coli (A) and Staphylococcus aureus (B) in response to yellow, green and orange colloidal AgNPs at 20 µg/ml in a time course of 24 h. The data represented as means ± SD from five repetitive samples.