Figures & data
Figure 1. SEM micrograph of HA nanoparticles.
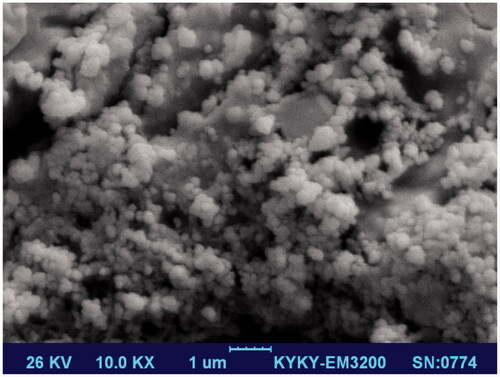
Figure 2. SEM micrograph of CA/Gel +25 mg nHA nanofibres.
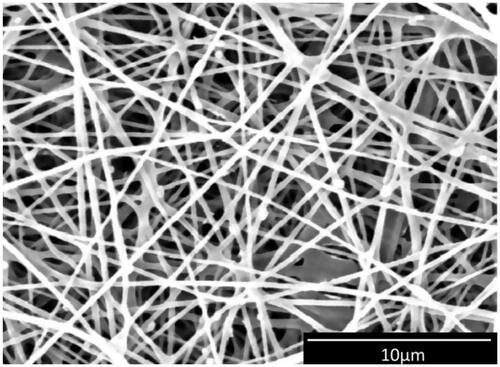
Table 1. Characterization of the wound dressings.
Figure 3. In vitro cell culture results: histogram comparing the proliferation of L929 cells on the wound dressings 48 h and 72 h after cell seeding. The positive control is tissue culture plate (TCP). The data are expressed as the mean ± SD, n = 3; *p < .05, **p < .01 (obtained by Student’s t-test).
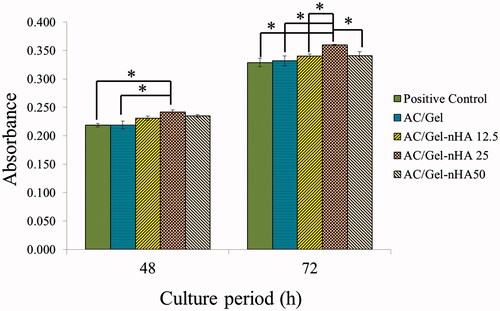
Figure 4. In vivo wound healing results. (A) Macroscopic appearances of the treated wounds 7 and 14 d post-wounding. (B) Histograms comparing the wound closure percentages of the wound dressings at the end of 7th and 14th day post-wounding. The data are expressed as mean ± SD, n = 5. * = Significant difference from all in day 7 (p < .05). **Significant difference from all in day 14 (p < .05).
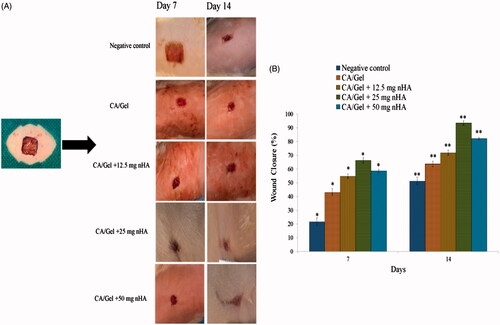
Figure 5. Haematoxylin–eosin-stained (H&E stained) microscopic sections of healed incisions in rats at 14 d: D: defect; positive control: normal skin; negative control: sterile gauze-treated wound; thick arrows in E: crusty scab; thick arrows in L: epidermal proliferation; arrows head in Q and R: foreign body reaction; thin arrow in R: chronic inflammatory cells.
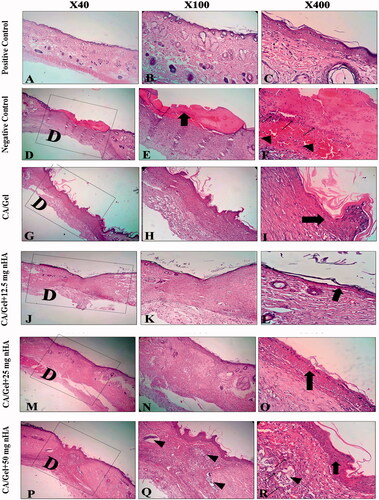
Figure 6. Masson’s trichrome (MT stained) microscopic sections of healed incisions in rats at 14 d. D: defect; positive control: normal skin; negative control: sterile gauze-treated wound; thick arrow in R: hair follicle; thick arrows in O: multinucleated giant cells; arrowheads in Q and R: collagen deposition; arrowheads in N: foreign body reaction; thin arrows: angiogenesis.
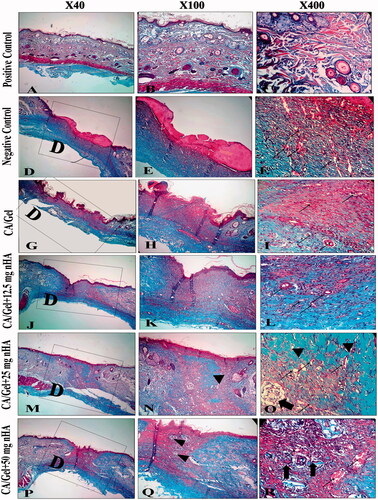
Figure 7. Epithelialization of healed incisions in rats at 14 d. Negative control: sterile gauze-treated wound, *p < .05, **p < .01.
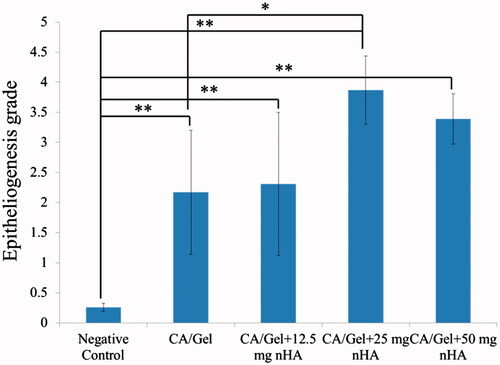
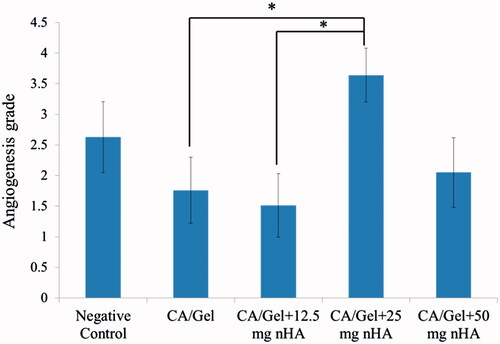
Figure 8. Angiogenesis of healed incisions in rats at 14 d. Negative control: sterile gauze-treated wound, *p < .05.